

Question: Help please Graph the PW(i) as a function of i for each cash flow shown. The range of interest-rate values for which these graphs should
Help please
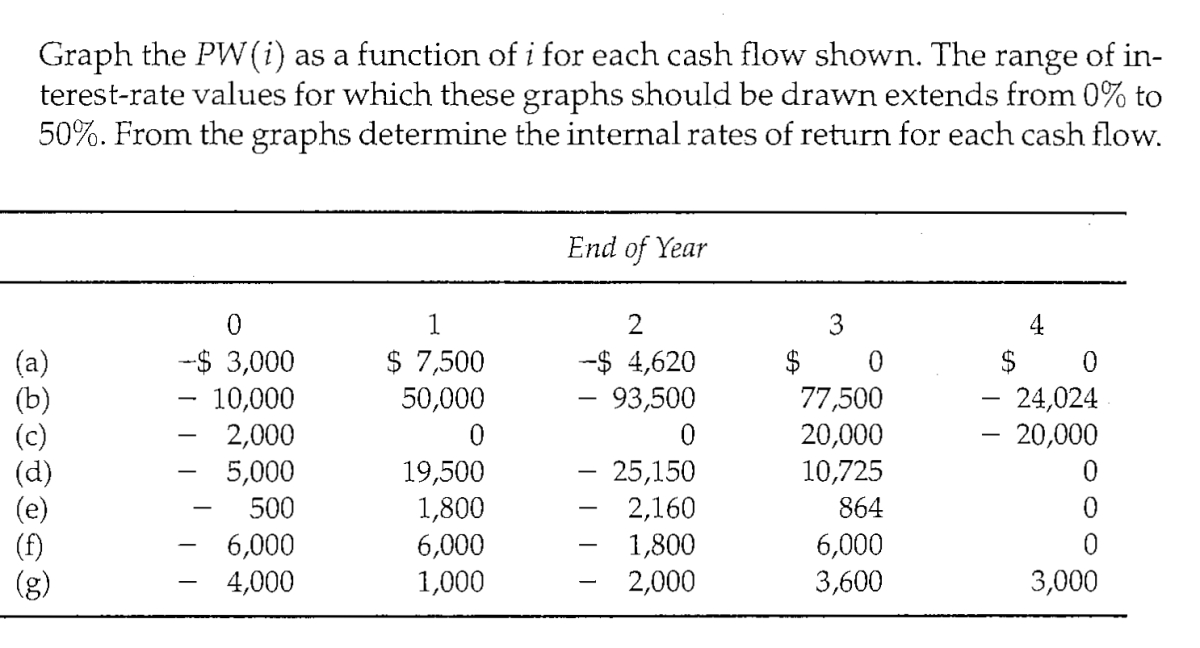
Graph the PW(i) as a function of i for each cash flow shown. The range of interest-rate values for which these graphs should be drawn extends from 0% to 50%. From the graphs determine the internal rates of return for each cash flow
Step by Step Solution
There are 3 Steps involved in it
1 Expert Approved Answer
Step: 1 Unlock

Question Has Been Solved by an Expert!
Get step-by-step solutions from verified subject matter experts
Step: 2 Unlock
Step: 3 Unlock