

Question: Help Please here is the code i have From this question, you will see that the second principal component has a strong relationship with 10-Year
Help Please
here is the code i have
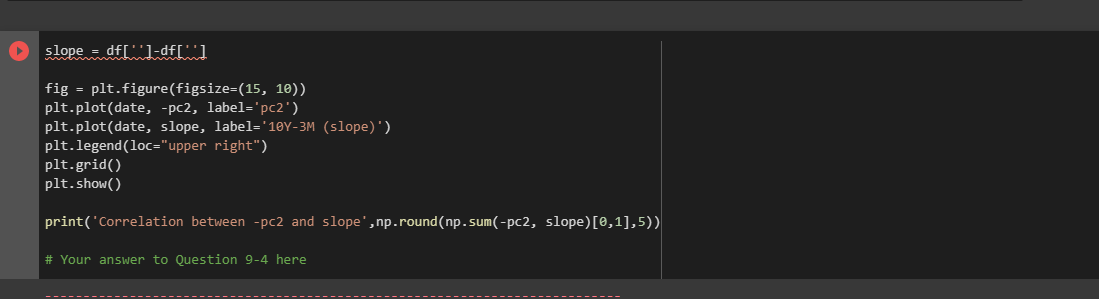
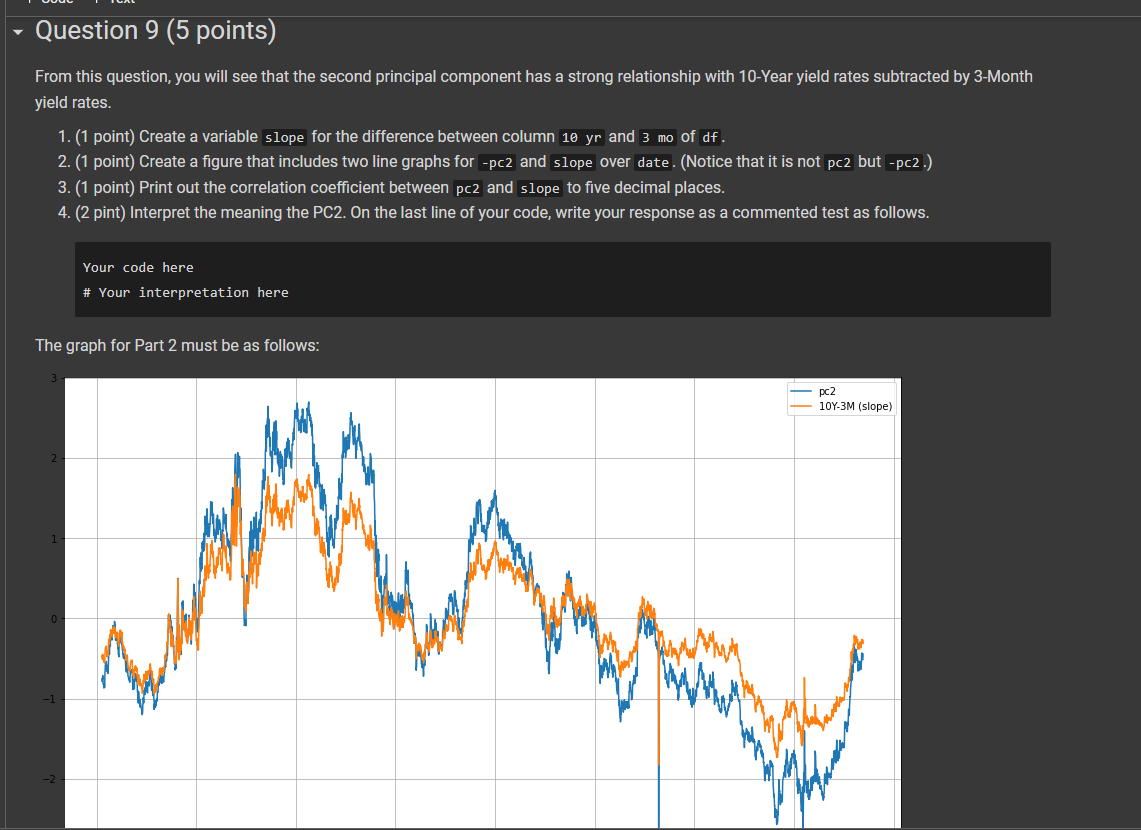
From this question, you will see that the second principal component has a strong relationship with 10-Year yield rates subtracted by 3-Month yield rates. 1. (1 point) Create a variable slope for the difference between column 10yr and 3 mo of df. 2. (1 point) Create a figure that includes two line graphs for pc2 and slope over date. (Notice that it is not pc2 but -pc2.) 3. (1 point) Print out the correlation coefficient between pc2 and slope to five decimal places. 4. (2 pint) Interpret the meaning the PC2. On the last line of your code, write your response as a commented test as follows. Your code here \# Your interpretation here The graph for Part 2 must be as follows: Slope = df[ [ [ d-df[ [': fig = plt.figure(figsize=(15, 10)) plt.plot(date, -pc2, label='pc2') plt.plot(date, slope, label='10Y-3M (slope)') plt.legend(loc="upper right") plt.grid() plt.show() print('Correlation between -pc2 and slope', np.round(np.sum(-pc2, slope) [,1],5) ) \# Your answer to Question 9-4 here
Step by Step Solution
There are 3 Steps involved in it

Get step-by-step solutions from verified subject matter experts