Question: help please! Homework Saved Help Save & Exit Submit 3 Check my work Ten samples of 15 parts each were taken from an ongoing process

help please! help please! Homework Saved Help Save & Exit
help please! Homework Saved Help Save & Exit
Homework Saved Help Save & Exit Submit 3 Check my work Ten samples of 15 parts each were taken from an ongoing process to establish a p-chart for control. The samples and the number of defectives in each are shown in the following table: SAMPLE 1 NM NUMBER OF DEFECTIVE ITEMS IN THE SAMPLE 0 2 0 3 1 3 1 0 0 0 n 15 15 15 15 15 15 15 15 15 4 5 6 7 B 9 10 es 15 a. Determine the p, Sp. UCL and LCL for a p-chart of 95 percent confidence (1.96 standard deviations). (Leave no cells blank - be certain to enter "O" wherever required. Round your answers to 3 decimal places.) p bar Sp UCL LCL b. What comments can you make about the process? Process is in statistical control. O Process is out of statistical control

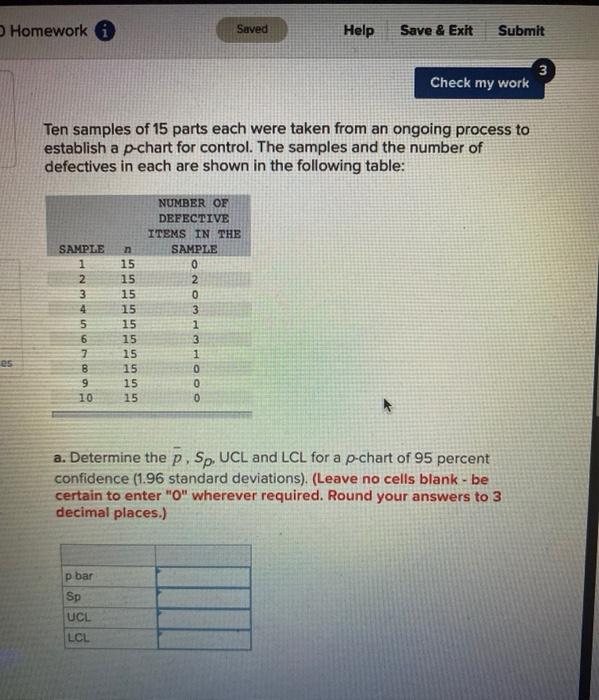
Step by Step Solution

There are 3 Steps involved in it

1 Expert Approved Answer
Step: 1 Unlock blur-text-image
Question Has Been Solved by an Expert!

Get step-by-step solutions from verified subject matter experts

Step: 2 Unlock
Step: 3 Unlock

Students Have Also Explored These Related General Management Questions!