

Question: Help please I'm stuck in part D E and F 8. [11/16 Points] DETAILS PREVIOUS ANSWERS BBUNDERSTAT12 9.2.011.NVA MY NOTES ASK YOUR TEACHER PRACTICE ANOTHER
Help please I'm stuck in part D E and F
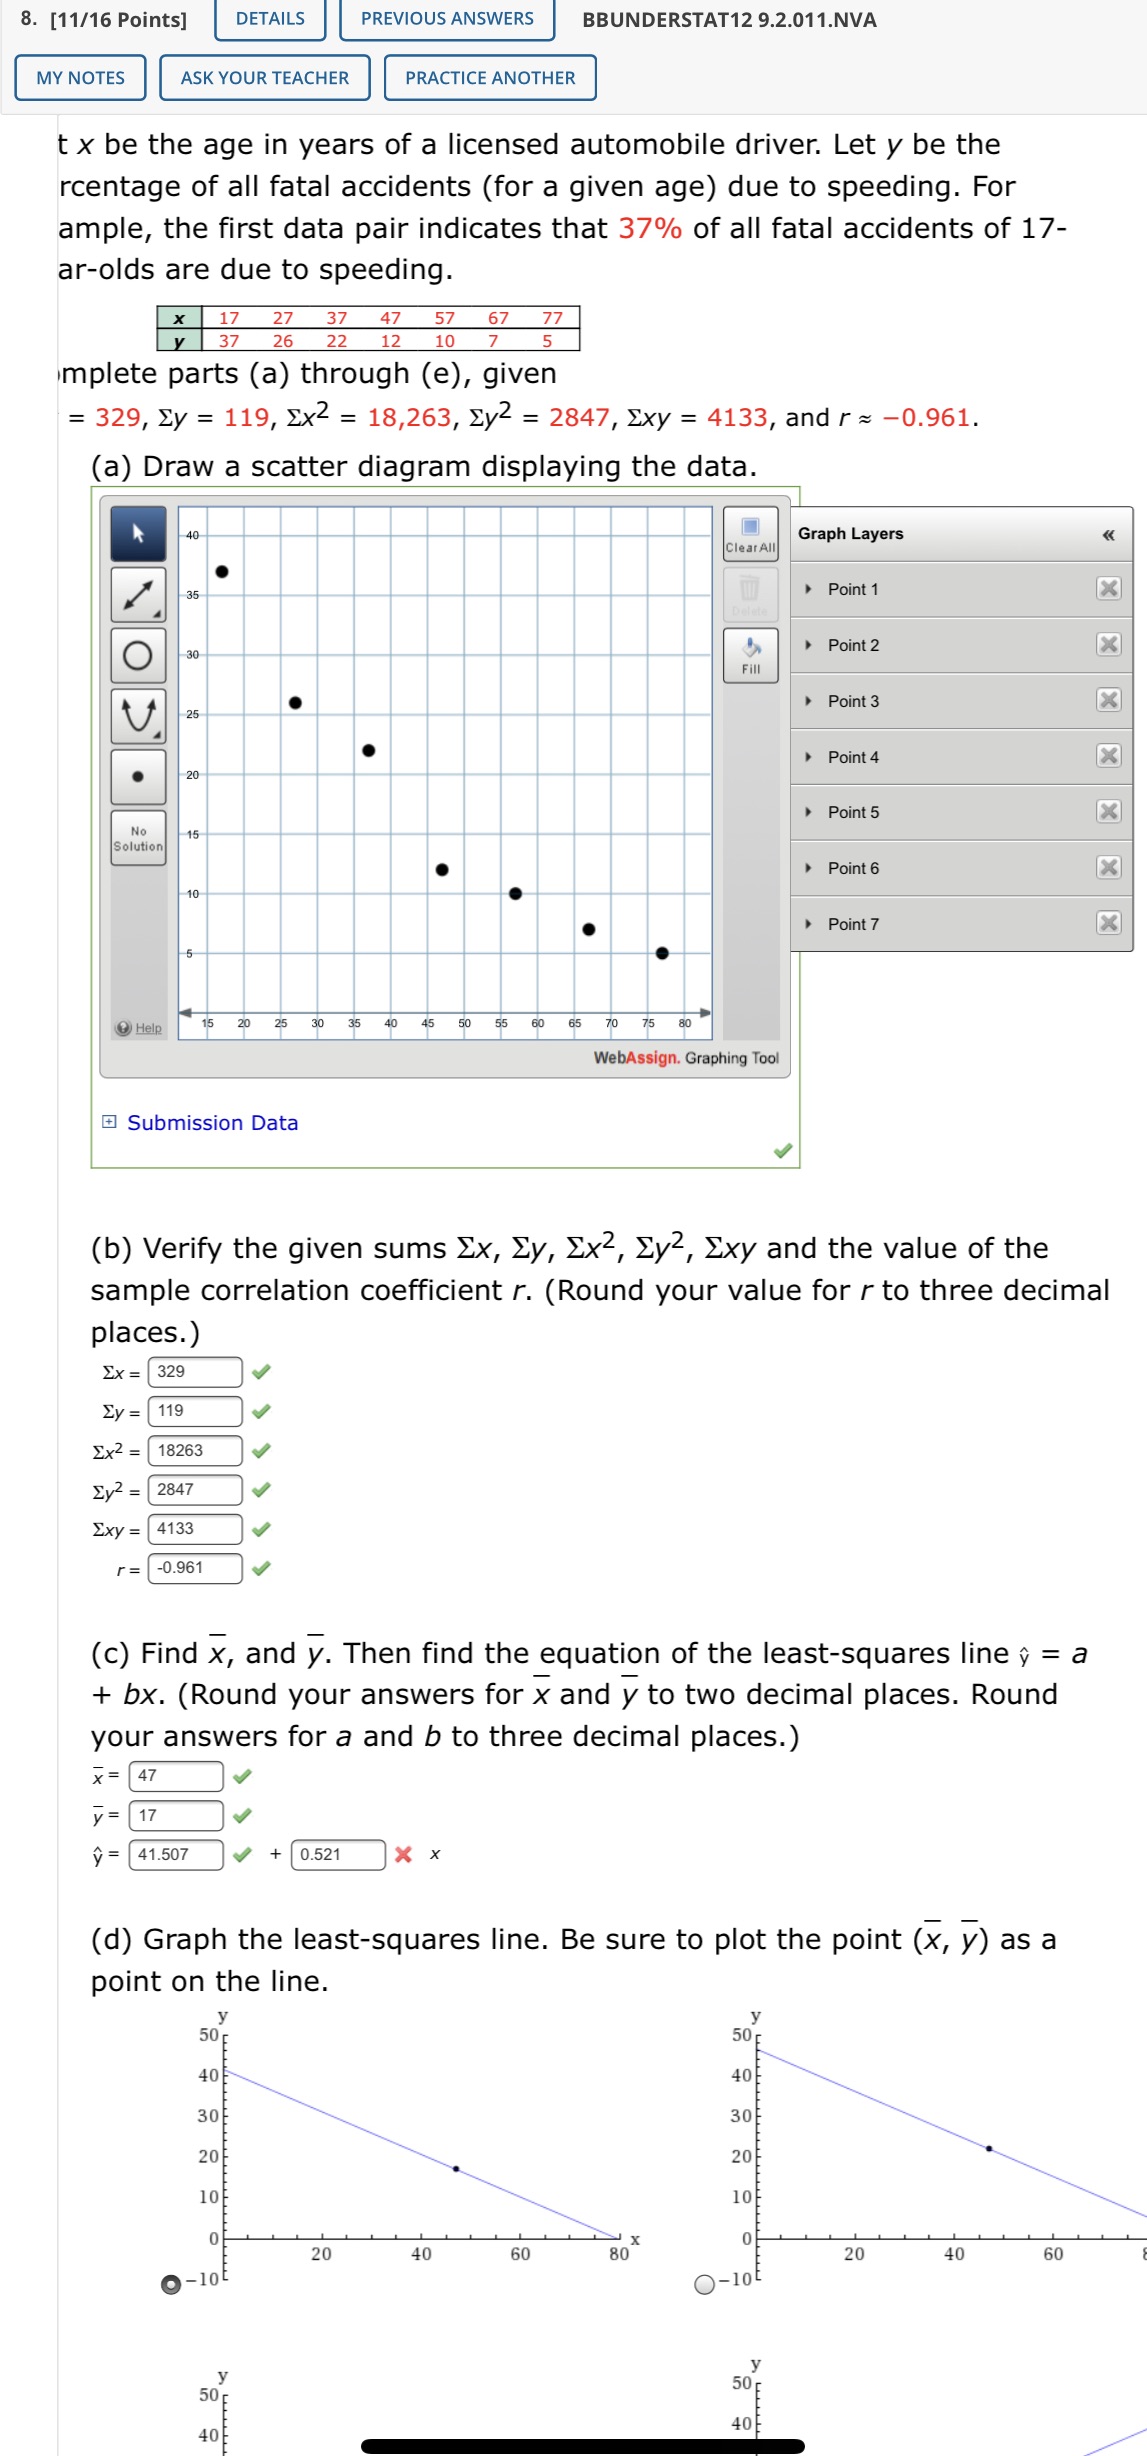
8. [11/16 Points] DETAILS PREVIOUS ANSWERS BBUNDERSTAT12 9.2.011.NVA MY NOTES ASK YOUR TEACHER PRACTICE ANOTHER t x be the age in years of a licensed automobile driver. Let y be the rcentage of all fatal accidents (for a given age) due to speeding. For ample, the first data pair indicates that 37% of all fatal accidents of 17- ar-olds are due to speeding. 17 37 27 26 37 47 12 57 10 67 77 mplete parts (a) through (e), given = 329, Ey = 119, Ex2 = 18,263, Ey2 = 2847, Exy = 4133, and r = -0.961. (a) Draw a scatter diagram displaying the data. 40 Clear All Graph Layers 35 Point 1 X Point 2 X 3 Fill Point 3 X . Point 4 X 20 Point 5 X No Solution -15 Point 6 X 10 Point 7 X -6 Help 15 20 25 30 35 40 45 50 55 60 65 70 75 80 WebAssign. Graphing Tool Submission Data (b) Verify the given sums Ex, Zy, Ex2, Zy2, Exy and the value of the sample correlation coefficient r. (Round your value for r to three decimal places.) Ex = 329 Ey = 119 Ex2 = 18263 Ey2 = 2847 Exy = 4133 r= -0.961 (c) Find x, and y. Then find the equation of the least-squares line y = a + bx. ( Round your answers for x and y to two decimal places. Round your answers for a and b to three decimal places.) x = 47 y = y = 41.507 0.521 X (d) Graph the least-squares line. Be sure to plot the point (x, y) as a point on the line. 50 50 F 40 40 30 30 20 206 LOE 0 20 40 60 X 80 O 20 40 60 -lot 50 50 40 40
Step by Step Solution
There are 3 Steps involved in it

Get step-by-step solutions from verified subject matter experts