

Question: help please! ' Safari File Edit View History Bookmarks Window Help ... Q @I ' mathxleom C; 0 ] ' [Tl ' Homework: HWK-Sec 9.2
help please!
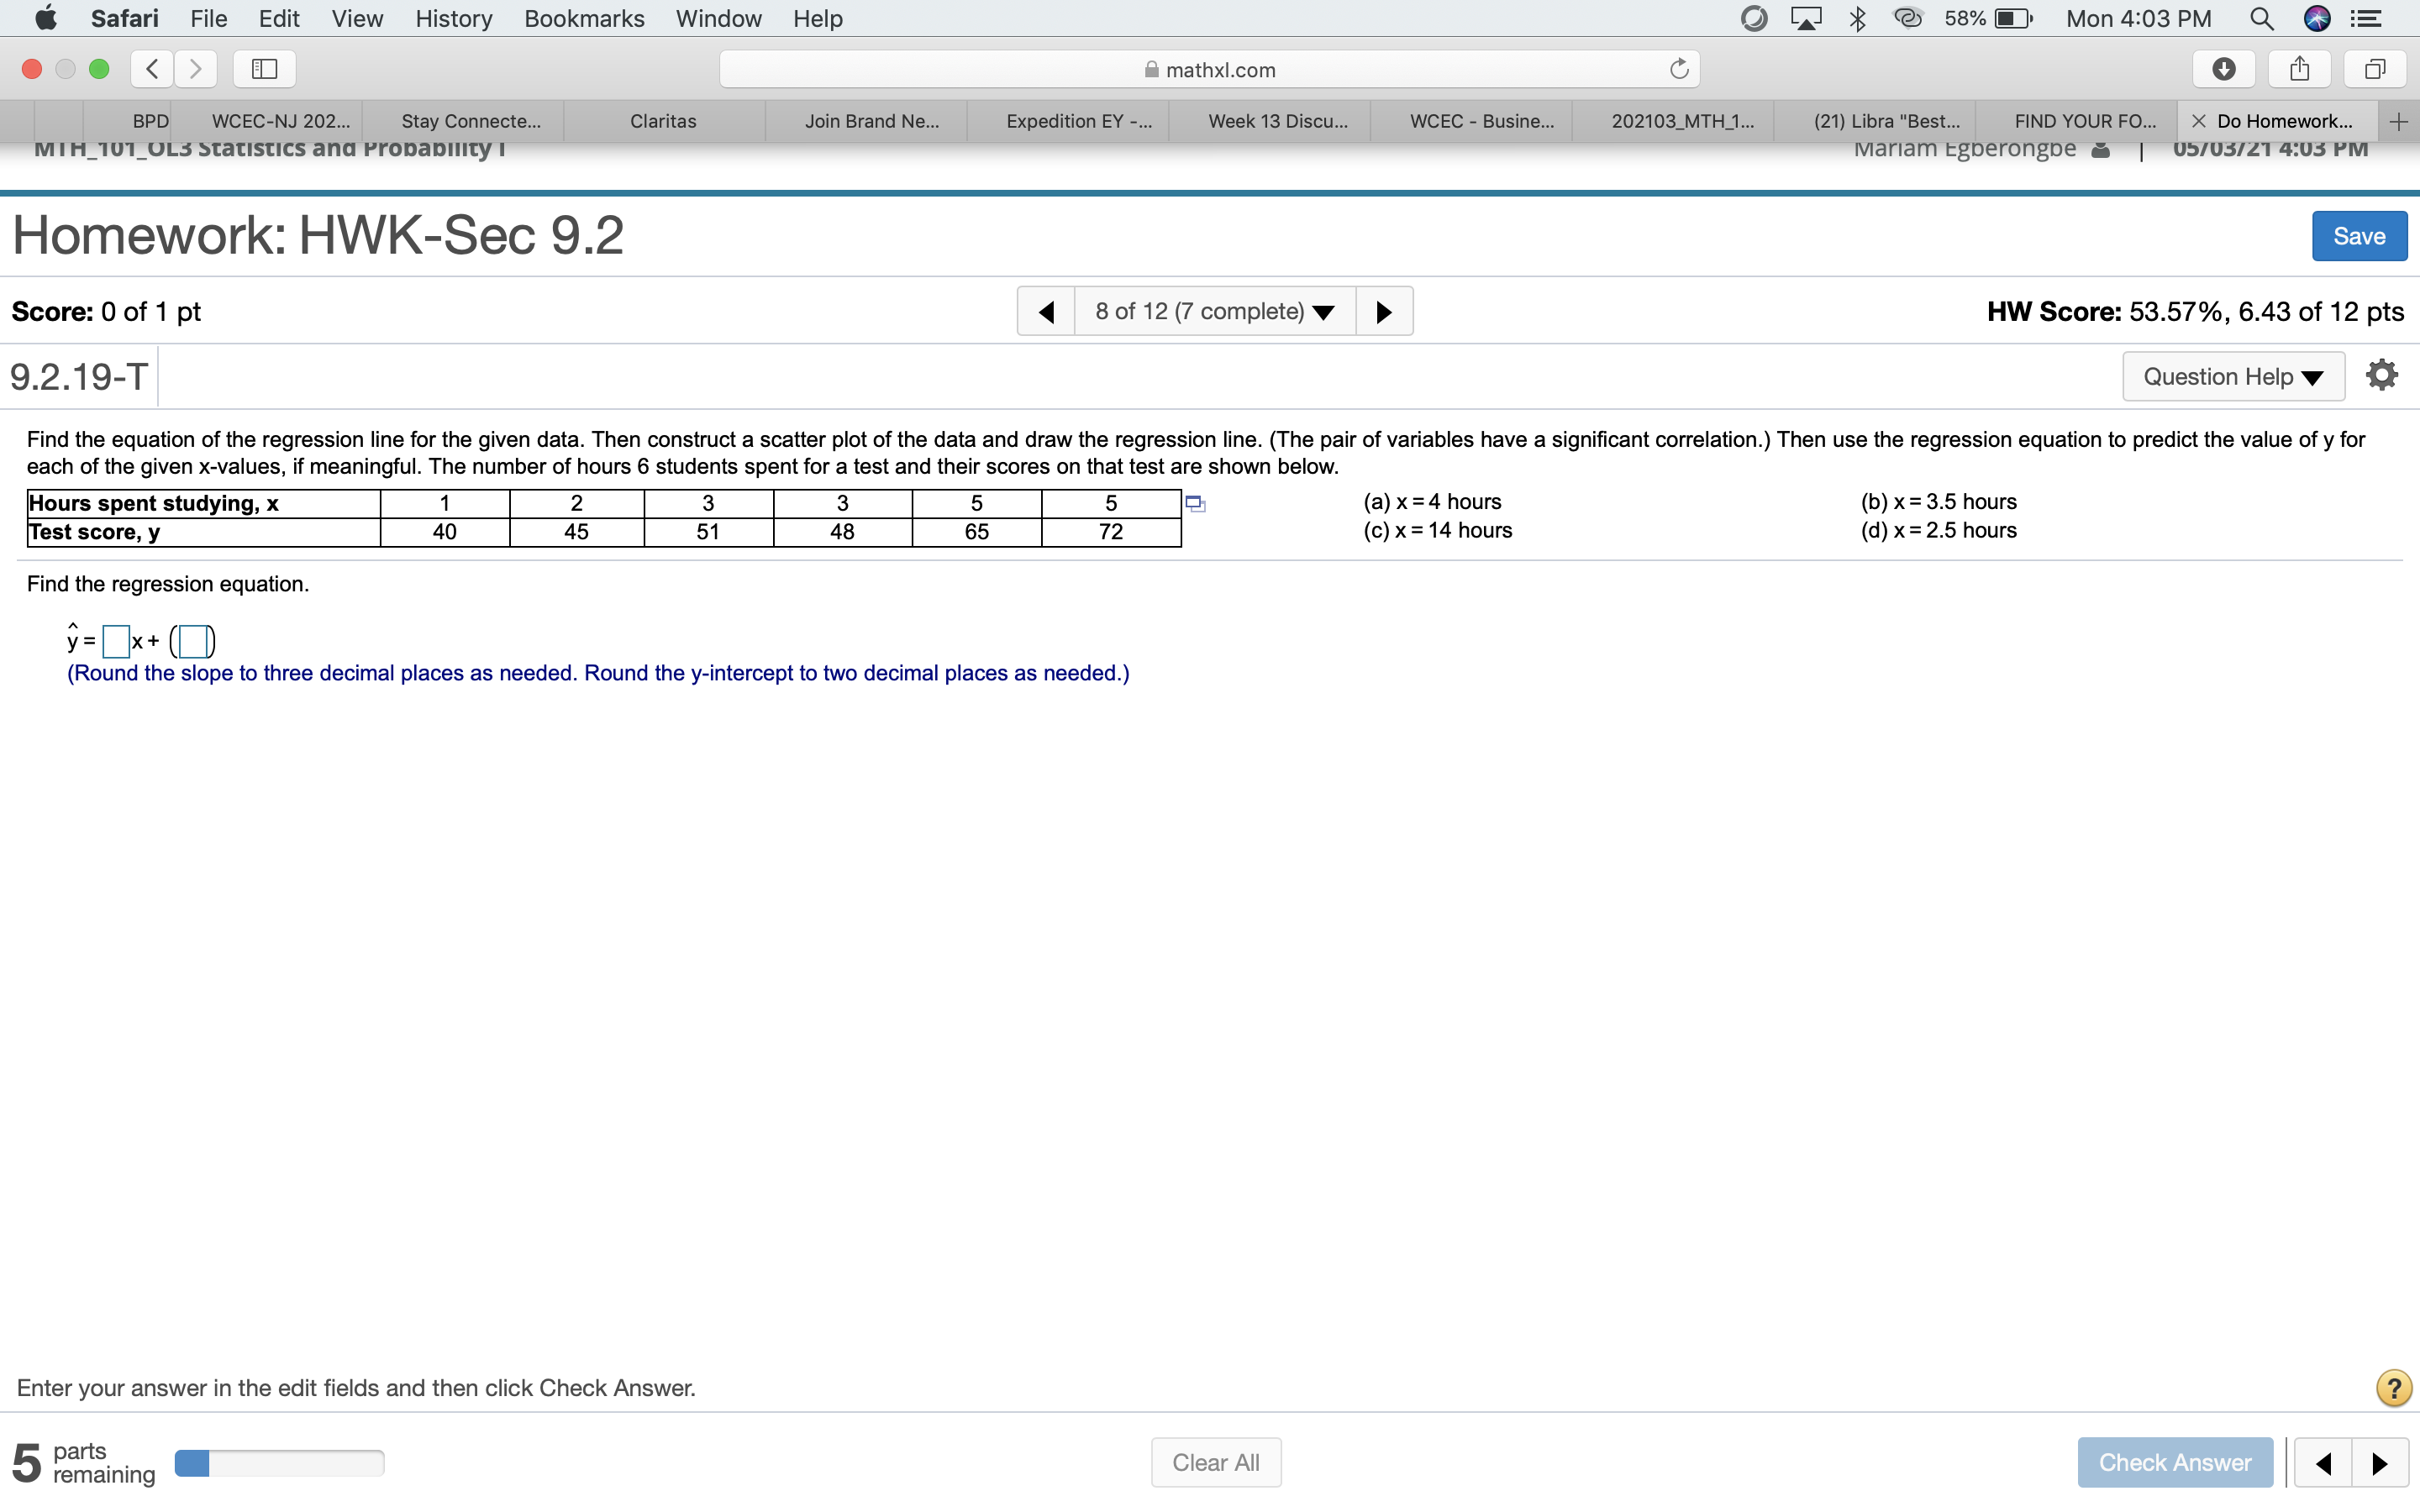
' Safari File Edit View History Bookmarks Window Help ... Q @I ' mathxleom C; 0 ] ' [Tl ' Homework: HWK-Sec 9.2 Score: 0 of 1 pt 4 8 of 12 (7 complete) V ) HW Score: 53.57%, 6.43 of 12 pts 9-2-19Tl c Find the equation of the regression line for the given data. Then construct a scatter plot of the data and draw the regression line. (The pair of variables have a signicant correlation.) Then use the regression equation to predict the value of y for each of the given xvalues, if meaningful. The number of hours 6 students spent for a test and their scores on that test are shown below. Hours spent studying, x 1 2 3 3 5 5 Q1 (3) x =4 hours (b) x= 35 hours Test score, y 40 45 51 48 65 12 (c) x = 14 hours ((1) x = .5 hours Find the regression equation. = x + D (Round the slope to three decimal places as needed. Round the y-intercept to two decimal places as needed.) Enter your answer in the edit fields and then click Check Answer. @ 5 remaining Clear All Check
Step by Step Solution
There are 3 Steps involved in it

Get step-by-step solutions from verified subject matter experts