

Question: Help Please .:Sample problems related to text's Chapter 1 Use the following situation to answer questions 1 through 3. For her dissertation, Roseanne needs to
Help Please
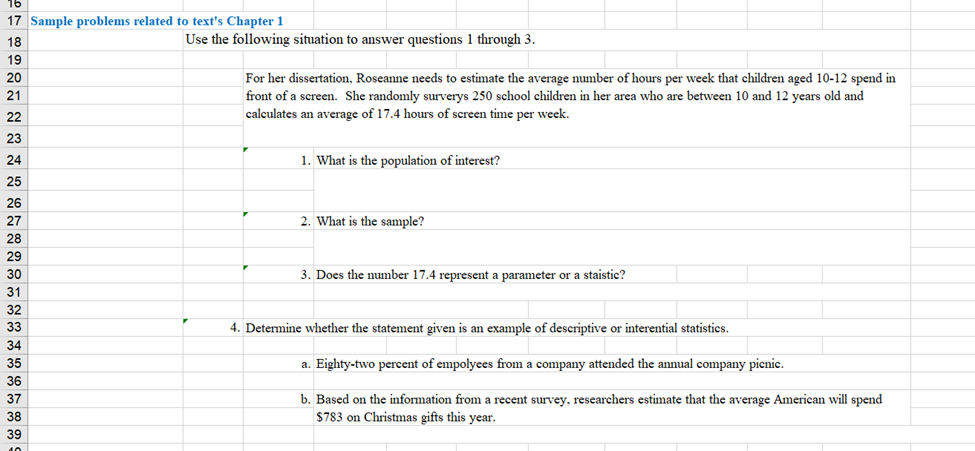
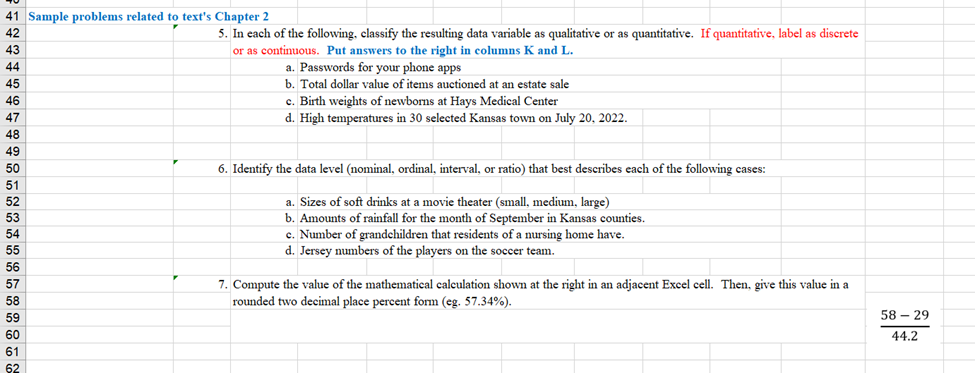
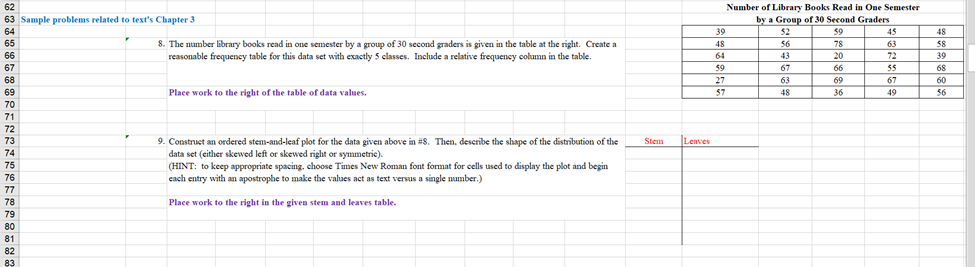
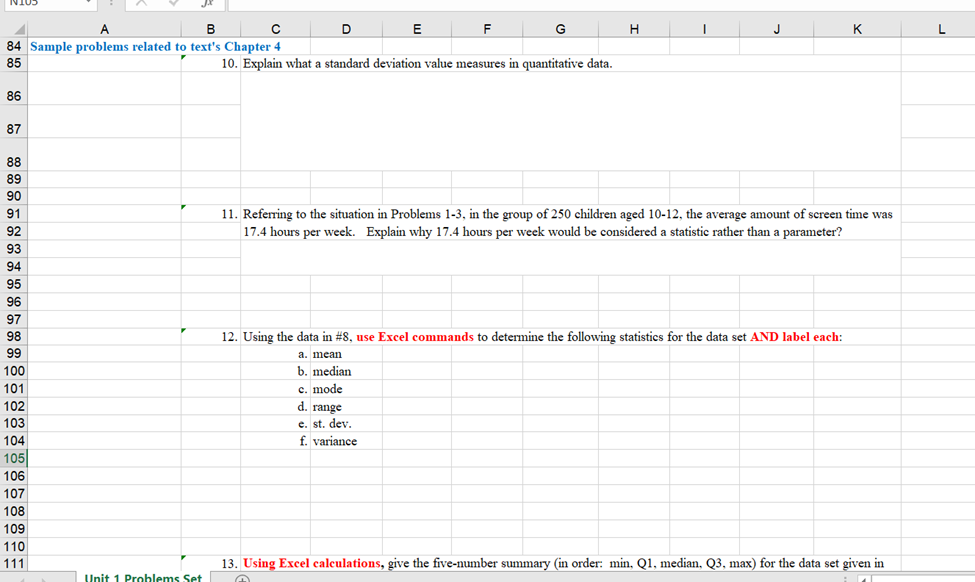
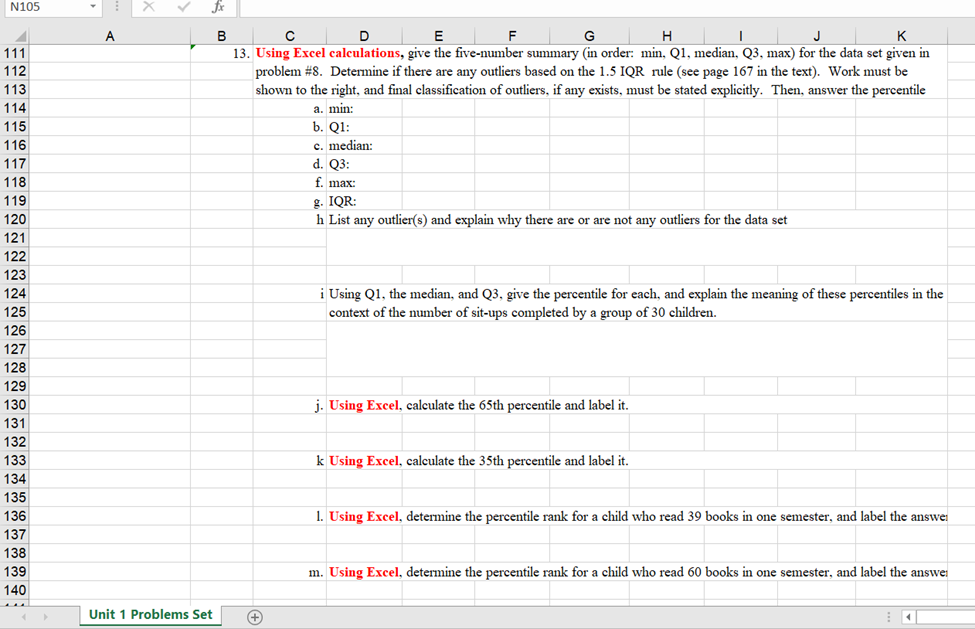
.:Sample problems related to text's Chapter 1 Use the following situation to answer questions 1 through 3. For her dissertation, Roseanne needs to estimate the average number of hours per week that children aged 10-12 spend in front of a screen. She randomly surverys 250 school children in her area who are between 10 and 12 years old and calculates an average of 17.4 hours of screen time per week. 1. What is the population of interest? 2. What is the sample? 3. Does the number 17.4 represent a parameter or a staistic? 4. Determine whether the statement given is an example of descriptive or interential statistics. a. Eighty-two percent of empolyees from a company attended the annual company picnic. b. Based on the information from a recent survey. researchers estimate that the average American will spend $783 on Christmas gifts this year. - 41 S[5E[Es 47 | :Saluple problems related to text's Chapter 2 5. In each of the following. classify the resulting data vanable as qualitative or as quantitative. If quantitative, label as discrete or as continuous. Put answers to the right in columns K and L. a. Passwords for your phone apps b. Total dollar value of items auctioned at an estate sale . Birth weights of newborns at Hays Medical Center d. High temperatures in 30 selected Kansas town on July 20, 2022. 48 | 49 r 6. Identify the data level (nominal, ordinal. interval, or ratio) that best describes each of the following cases: 51| G5G5288 58 a. Sizes of soft drinks at a movie theater (small, medium, large) b. Amounts of rainfall for the month of September in Kansas counties. c. Number of grandchildren that residents of a nursing home have. d. Jersey numbers of the players on the soccer team. 7. Compute the value of the mathematical caleulation shown at the right in an adjacent Excel cell. Then, give this value in a rounded two decimal place percent form (eg. 57.34%). 60 61 58 - 29 44.2 62 Number of Library Books Read in One Semester 63 Sample problems related to text's Chapter 3 by a Group of 30 Second Graders 64 39 59 45 48 65 8. The number library books read in one semester by a group of 30 second graders is given in the table at the right. Create a 48 78 $8 66 reasonable frequency table for this data set with exactly 5 classes. Include a relative frequency column in the table. 64 43 20 72 30 67 59 67 66 68 68 27 63 69 67 60 69 Place work to the right of the table of data values. 48 36 49 56 70 71 72 73 9. Construct an ordered stem-and-leaf plot for the data given above in #8. Then. describe the shape of the distribution of the Stem Leaves 74 data set (either skewed left or skewed right or symmetric). 75 (HINT: to keep appropriate spacing. choose Times New Roman font format for cells used to display the plot and begin 76 each entry with an apostrophe to make the values act as text versus a single number.) 77 78 Place work to the right in the given stem and leaves table. 79 80 81 82 83nNiUD 3 Jr A A e c | D | E | E | G | H | | | J | K 84 |Sample problems related to text's Chapter 4 10. Explain what a standard deviation value measures in quantitative data. % 4 87 | 88 89 | 90 o1 | [ 11. Referring to the situation in Problems 1-3, in the group of 250 children aged 10-12, the average amount of screen time was 92 | 17.4 hours per week. Explain why 17.4 hours per week would be considered a statistic rather than a parameter? 93 s 95 { % 4 97 98 [ 12. Using the data in #8, use Excel commands to determine the following statistics for the data set AND label each: 99 a. mean 100 b. median 101 c. mode 102 d. range 103 e. st. dev. 104 f. variance 10 106 107 108 109 110 111 r 13. Using Excel caleulations, give the five-number summary (in order: min. Q1. median, Q3. max) for the data set given in | Unit 1 Prahlems Set = BlaT N105 - | I i A B c D E F G H 1 J K 111 ) r 13. Using Excel calculations, give the five-number summary (in order: min. Q1. median. Q3. max) for the data set g'n n 1" 2: problem #8. Determine if there are any outliers based on the 1.5 IQR. rule (see page 167 in the text). Work must be 113 shown to the right, and final classification of outliers. if any exists, must be stated explicitly. Then. answer the percentile 114 a. min: 115 b. QL: 116 . median: 17 d. Q3: 118 f. max: 1189 g. IQR: 120 h List any outlier(s) and explain why there are or are not any outliers for the data set 121 122 123 124 i Using Q1. the median, and Q3, give the percentile for each, and explain the meaning of these percentiles in the 125 context of the number of sit-ups completed by a group of 30 children. 126 127, 128 129 130 j. Using Excel. calculate the 65th percentile and label it. 131 132 133: k Using Excel, calculate the 35th percentile and label it. 134 135 136 l. Using Excel. determine the percentile rank for a child who read 39 books in one semester, and label the answe: 137 138 139 m. Using Excel. determine the percentile rank for a child who read 60 books in one semester, and label the answe: 140 s | Unit 1 Problems Set | @ Pl Nivg 133 134 135 136 137 138 139 140 141 142 143 144 145 146 147 148 149 150 151, 152 153 154 155 156 157 158 159 160 161 162 JE A S | N S S O = O SO = S B, C5 W 1 O S S| | 1
Step by Step Solution
There are 3 Steps involved in it

Get step-by-step solutions from verified subject matter experts