

Question: help please TABLE A Normal curve tall probat es. Standard normal probability in fight-hand tail (for negative TABLE S: 1 Distribution Critical Values Confidence Level
help please
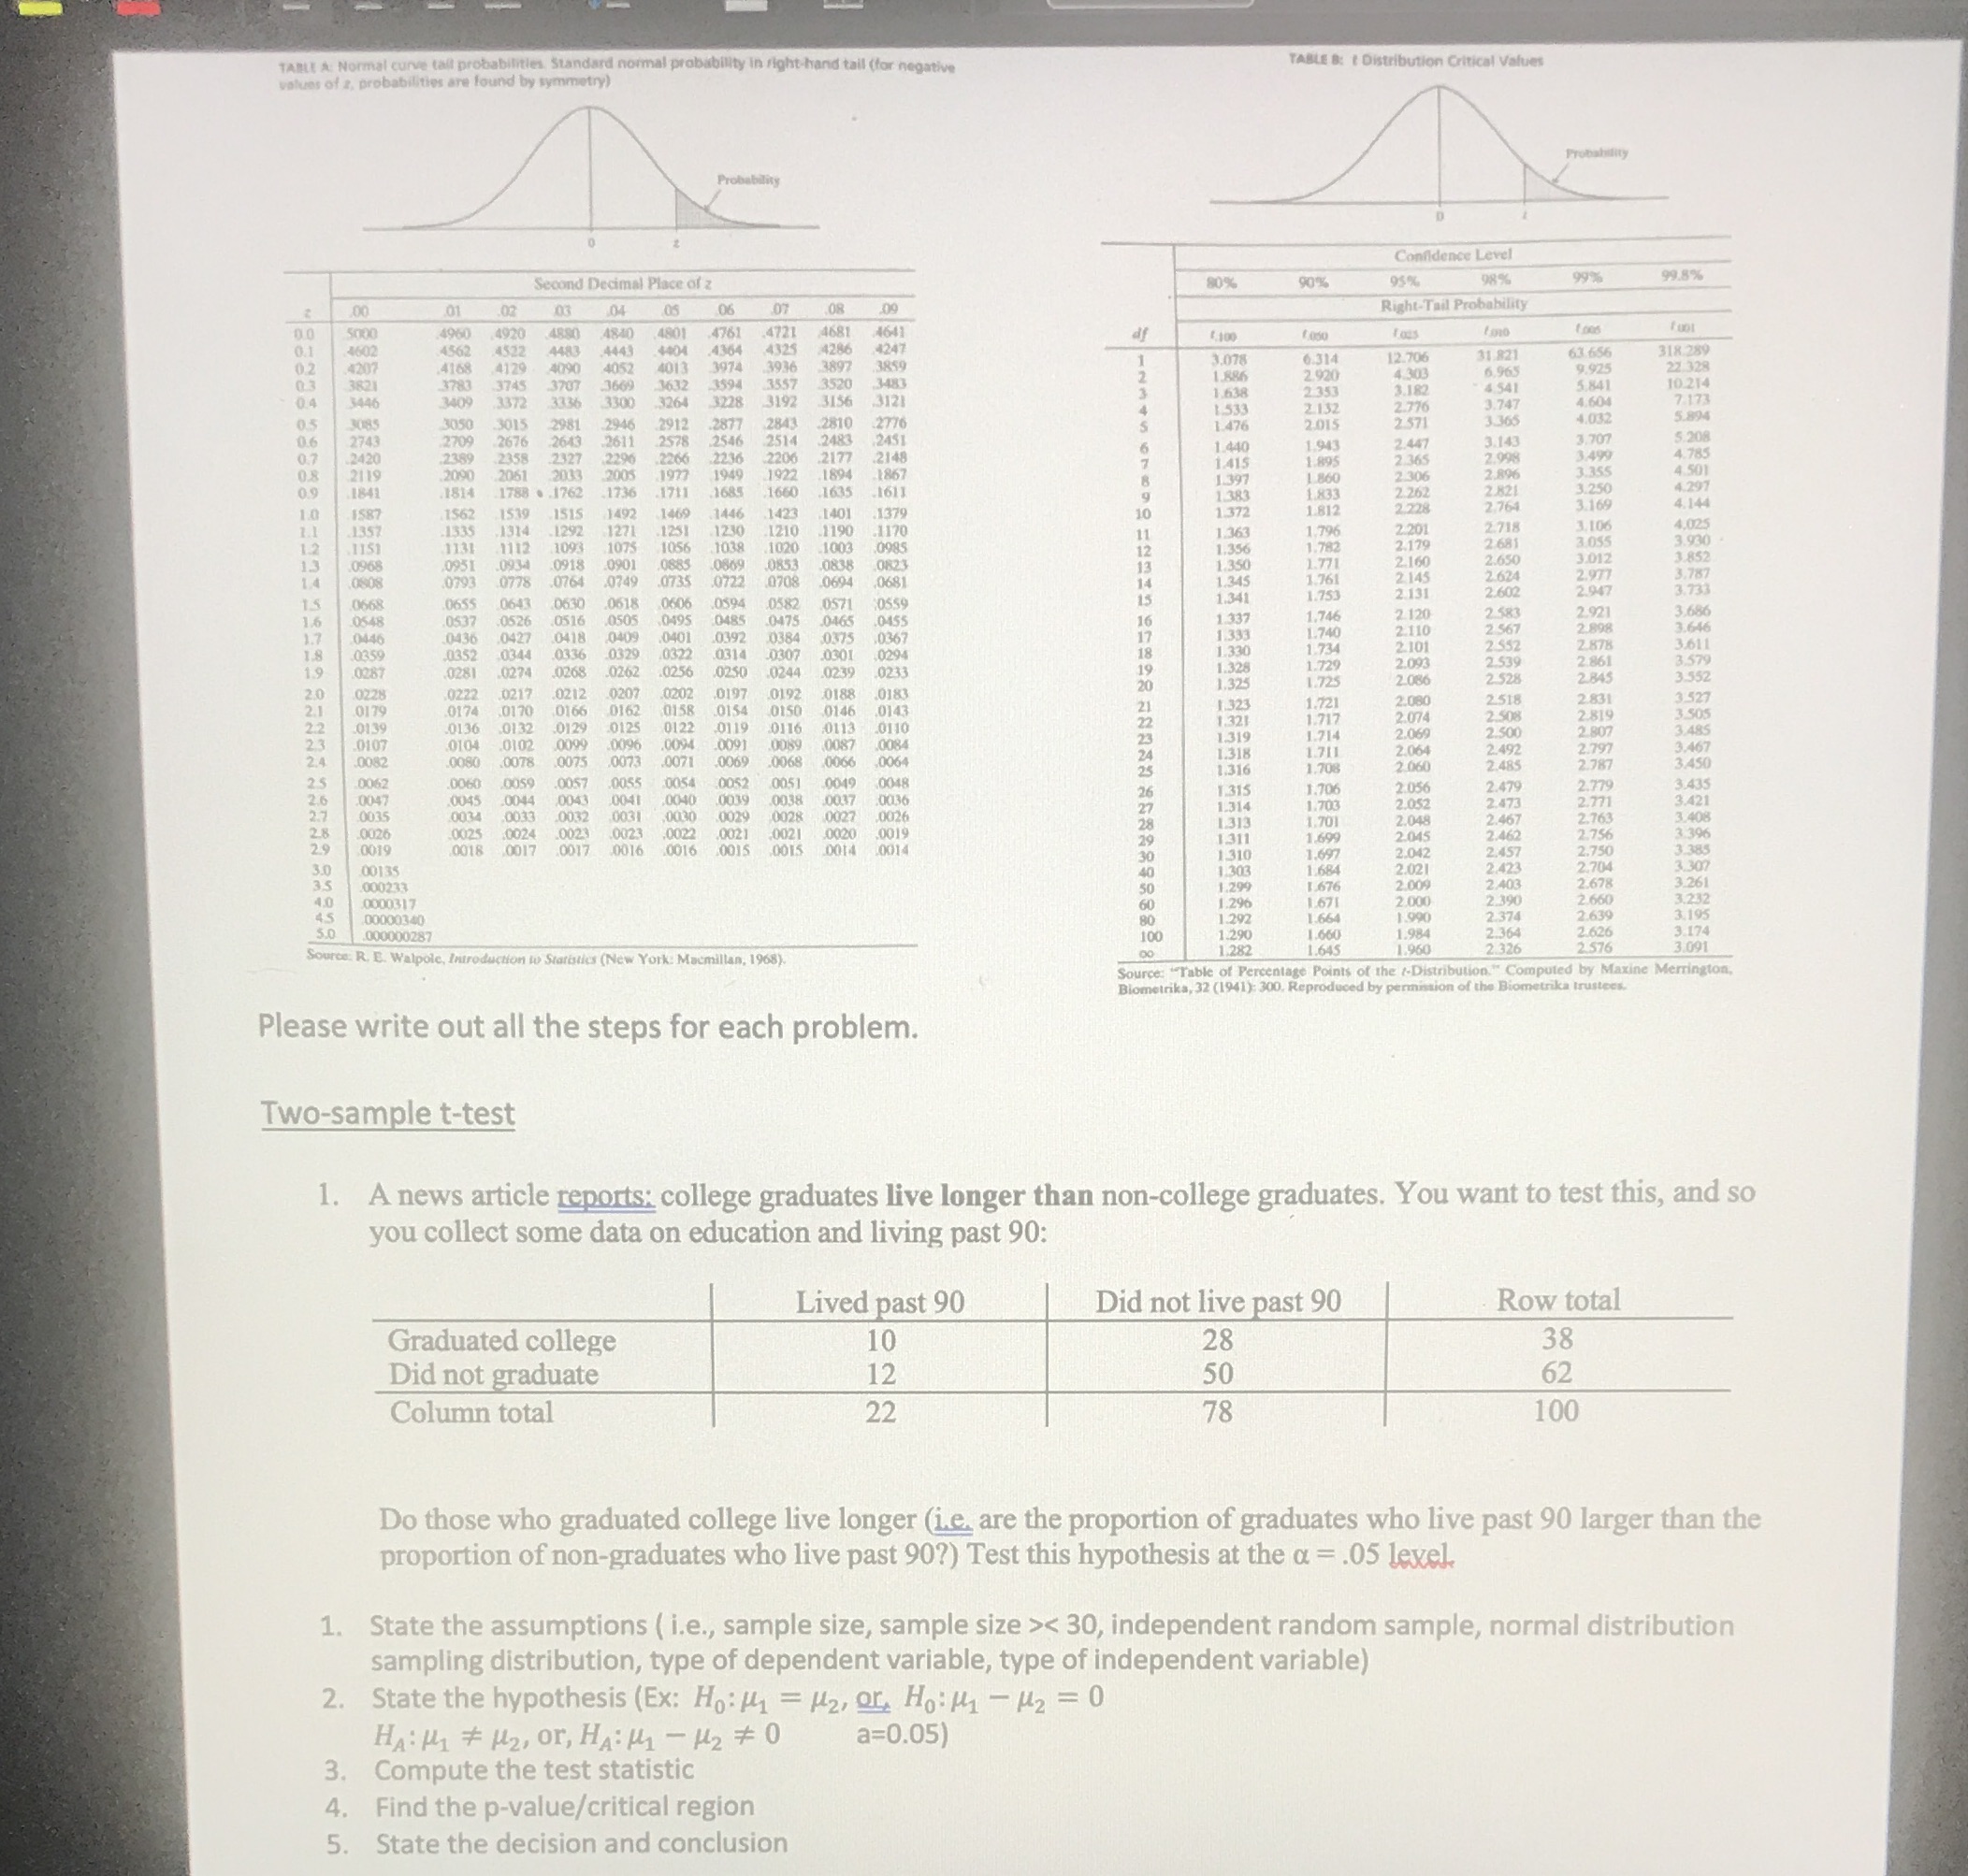
TABLE A Normal curve tall probat es. Standard normal probability in fight-hand tail (for negative TABLE S: 1 Distribution Critical Values Confidence Level Second Decimal Place of 2 80% 90% 95% 98% 99% 99.8% Right-Tail Probability Foot 12.70% 27 328 1.604 NNNNNNNNNNNNNNNN NNNN 00135 0000317 00000340 000000287 ource: R. E. Walpole, Introd aties (New York: Macmillan, 1968) Source : 32 (1941): 300. Reproduced by permini Please write out all the steps for each problem. Two-sample t-test 1. A news article reports: college graduates live longer than non-college graduates. You want to test this, and so you collect some data on education and living past 90: Lived past 90 Did not live past 90 Row total Graduated college 10 28 38 Did not graduate 12 50 62 Column total 22 78 100 Do those who graduated college live longer (ie. are the proportion of graduates who live past 90 larger than the proportion of non-graduates who live past 90?) Test this hypothesis at the a = .05 level 1. State the assumptions ( i.e., sample size, sample size >
Step by Step Solution
There are 3 Steps involved in it

Get step-by-step solutions from verified subject matter experts