

Question: Help please !!! The comparative financial figures and common size statements along with industry averages for Alpha Corporation are depicted below: Balance Sheet Vertical Horizontal
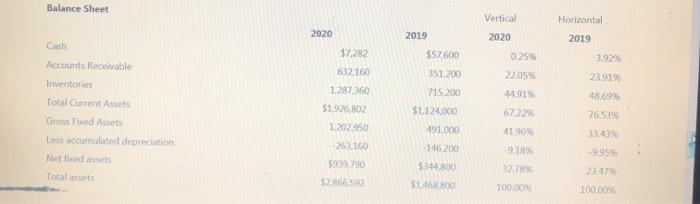
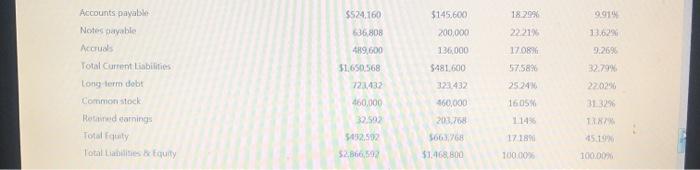
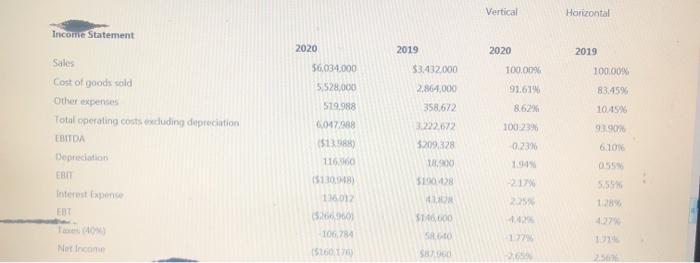
Balance Sheet Vertical Horizontal 2020 2019 2020 2019 $57,600 3.92 $7,282 632,160 351200 0.25% 22.05% 1191 23.919 48.699 715200 Accounts Receivable Inventories Total Current Assets Gross Fixed Assets Les accumulated depreciation Net fixed acts 1.787 360 51.926802 67.229 76.539 SL12000 491.000 1.202.950 41.96 33.23 9.189 263,260 5949,790 -9.95% 146.200 $144.800 S146.800 32789 Totalets 100009 100.00 $145,600 18.20 9919 13.629 9:2690 Accounts payable Notes payable Accrual Total current liabilities Long term debt Common stock Red camning Tocal Equity Total Latestquity $524.160 636 808 489,600 51.650.568 723432 460,000 32.592 22:21 17.08% 575898 200.000 13,000 $481.600 3232432 $60,000 2524 16:05 31.32% TRR 5432,502 203.768 566768 51.168.800 17189 52.566,592 10000 100.00 Vertical Horizontal Income Statement 2020 2020 2019 2019 $3.432.000 100.0096 100.00% $6,034.000 5.528.000 2.864,000 91.618 83.45% Sale Cost of goods sold Other expenses Total operating costs excluding depreciation EBITDA 358,672 1049% 579,988 0.047.088 (533) 8.62% 100 23% 92901 3.222.672 3209,328 0.23 6.105 Depreciation FIBI 05 18.900 $10.08 -21 1100 1513048 1380) 5269 555 EBT S16000 SRO 177 106.784 151617 SU 2560 Required: 1. Carry out Horizontal and Vertical Analysis of the company for both years using Common Size Statements to comment on the changes in the financial standing of the company over the two years relative to itself. (Just doing calculations or stating increased ar decrecord WILL NOT entitle you to full grade) 2. Carry out Du Pont Analysis for both years and comment in the strengthened or weakenedarwis of management, (Just doing calculations or stating increased or decreased WILL NOT entitle you to full grade). Balance Sheet Vertical Horizontal 2020 2019 2020 2019 $57,600 3.92 $7,282 632,160 351200 0.25% 22.05% 1191 23.919 48.699 715200 Accounts Receivable Inventories Total Current Assets Gross Fixed Assets Les accumulated depreciation Net fixed acts 1.787 360 51.926802 67.229 76.539 SL12000 491.000 1.202.950 41.96 33.23 9.189 263,260 5949,790 -9.95% 146.200 $144.800 S146.800 32789 Totalets 100009 100.00 $145,600 18.20 9919 13.629 9:2690 Accounts payable Notes payable Accrual Total current liabilities Long term debt Common stock Red camning Tocal Equity Total Latestquity $524.160 636 808 489,600 51.650.568 723432 460,000 32.592 22:21 17.08% 575898 200.000 13,000 $481.600 3232432 $60,000 2524 16:05 31.32% TRR 5432,502 203.768 566768 51.168.800 17189 52.566,592 10000 100.00 Vertical Horizontal Income Statement 2020 2020 2019 2019 $3.432.000 100.0096 100.00% $6,034.000 5.528.000 2.864,000 91.618 83.45% Sale Cost of goods sold Other expenses Total operating costs excluding depreciation EBITDA 358,672 1049% 579,988 0.047.088 (533) 8.62% 100 23% 92901 3.222.672 3209,328 0.23 6.105 Depreciation FIBI 05 18.900 $10.08 -21 1100 1513048 1380) 5269 555 EBT S16000 SRO 177 106.784 151617 SU 2560 Required: 1. Carry out Horizontal and Vertical Analysis of the company for both years using Common Size Statements to comment on the changes in the financial standing of the company over the two years relative to itself. (Just doing calculations or stating increased ar decrecord WILL NOT entitle you to full grade) 2. Carry out Du Pont Analysis for both years and comment in the strengthened or weakenedarwis of management, (Just doing calculations or stating increased or decreased WILL NOT entitle you to full grade)
Step by Step Solution
There are 3 Steps involved in it

Get step-by-step solutions from verified subject matter experts