

Question: Help please The following data represents data collected by a STATISTICS INSTRUCTOR. The data examines the relationship between TIME SPENT ON MYSTATLAB SITE(TSM) and MIDTERM
Help please
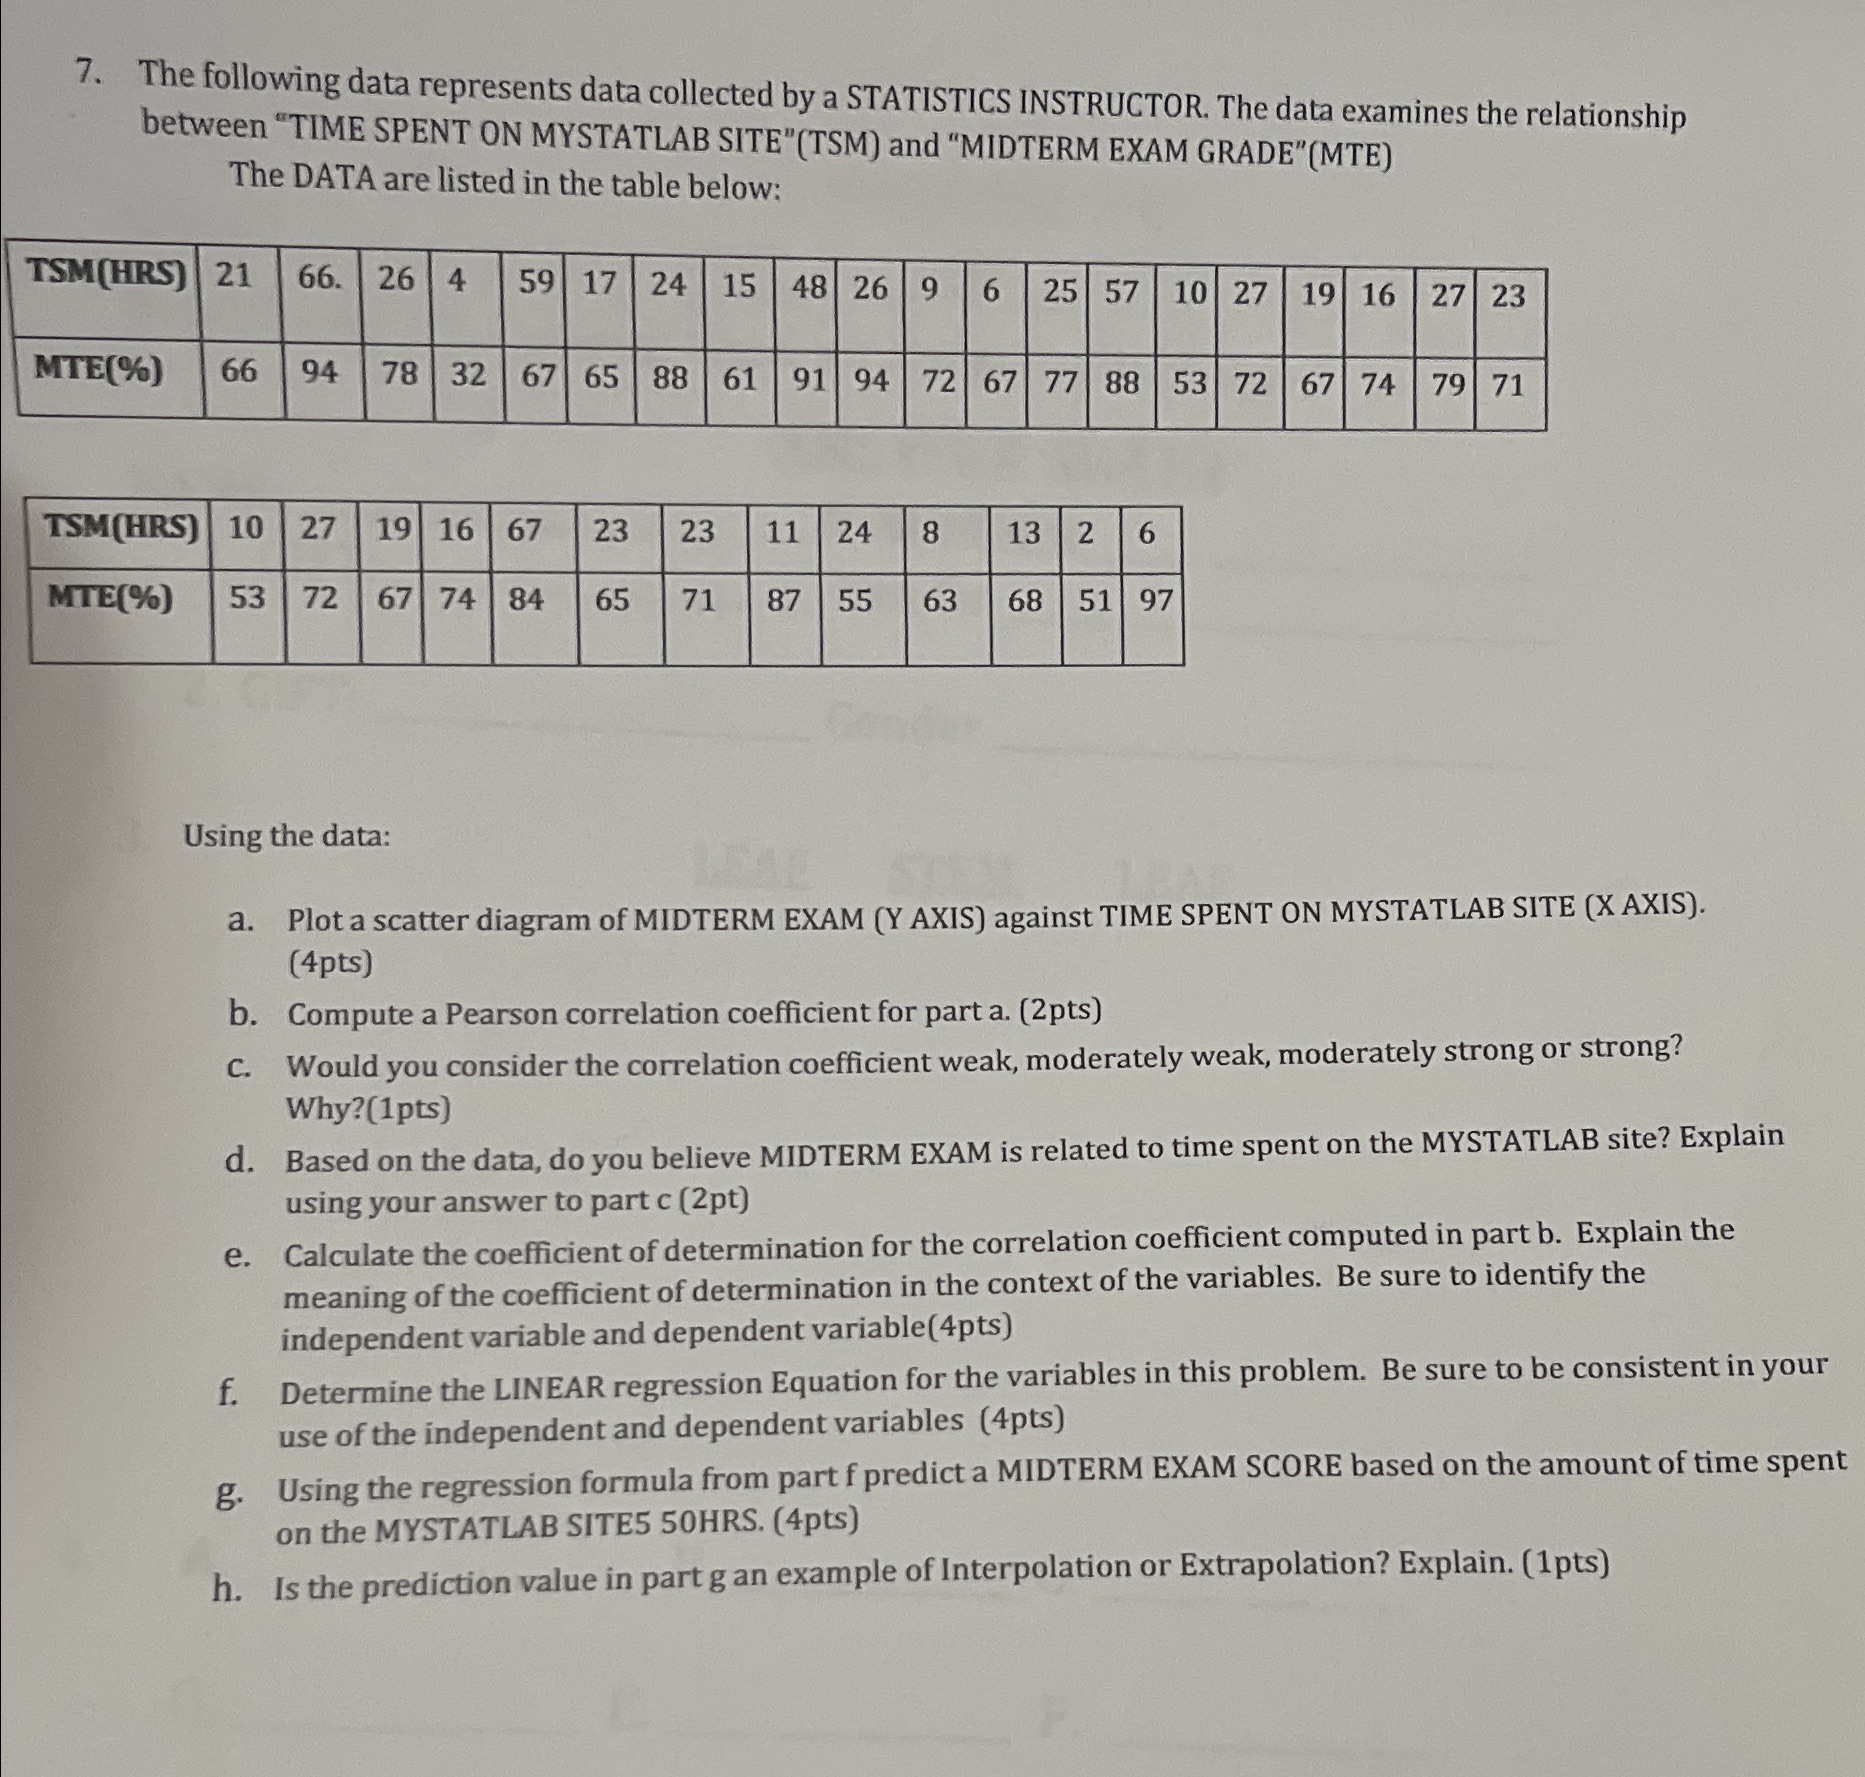
The following data represents data collected by a STATISTICS INSTRUCTOR. The data examines the relationship between "TIME SPENT ON MYSTATLAB SITE"(TSM) and "MIDTERM EXAM GRADE"(MTE) The DATA are listed in the table below: TSM (HRS) 21 66. 26 4 59 17 24 15 48 26 9 6 25 57 10 27 19 16 27 23 MTE(%) 66 94 78 32 67 65 88 61 91 94 72 67 77 88 53 72 67 74 79 71 TSM(HRS) 10 27 19 16 67 23 23 11 24 13 2 6 MTE(%) 53 72 67 74 84 71 87 55 68 51 97 Using the data: a. Plot a scatter diagram of MIDTERM EXAM (Y AXIS) against TIME SPENT ON MYSTATLAB SITE (X AXIS). (4pts) b. Compute a Pearson correlation coefficient for part a. (2pts) C. Would you consider the correlation coefficient weak, moderately weak, moderately strong or strong? Why?(1pts) d. Based on the data, do you believe MIDTERM EXAM is related to time spent on the MYSTATLAB site? Explain using your answer to part c (2pt) e. Calculate the coefficient of determination for the correlation coefficient computed in part b. Explain the meaning of the coefficient of determination in the context of the variables. Be sure to identify the independent variable and dependent variable(4pts) f. Determine the LINEAR regression Equation for the variables in this problem. Be sure to be consistent in your use of the independent and dependent variables (4pts) g. Using the regression formula from part f predict a MIDTERM EXAM SCORE based on the amount of time spent on the MYSTATLAB SITES 50HRS. (4pts) h. Is the prediction value in part g an example of Interpolation or Extrapolation? Explain. (1pts)
Step by Step Solution
There are 3 Steps involved in it

Get step-by-step solutions from verified subject matter experts