

Question: help please The following table represents data collected from the 2004 National Election Survey. The hypothesis you are considering is whether or not home ownership
help please
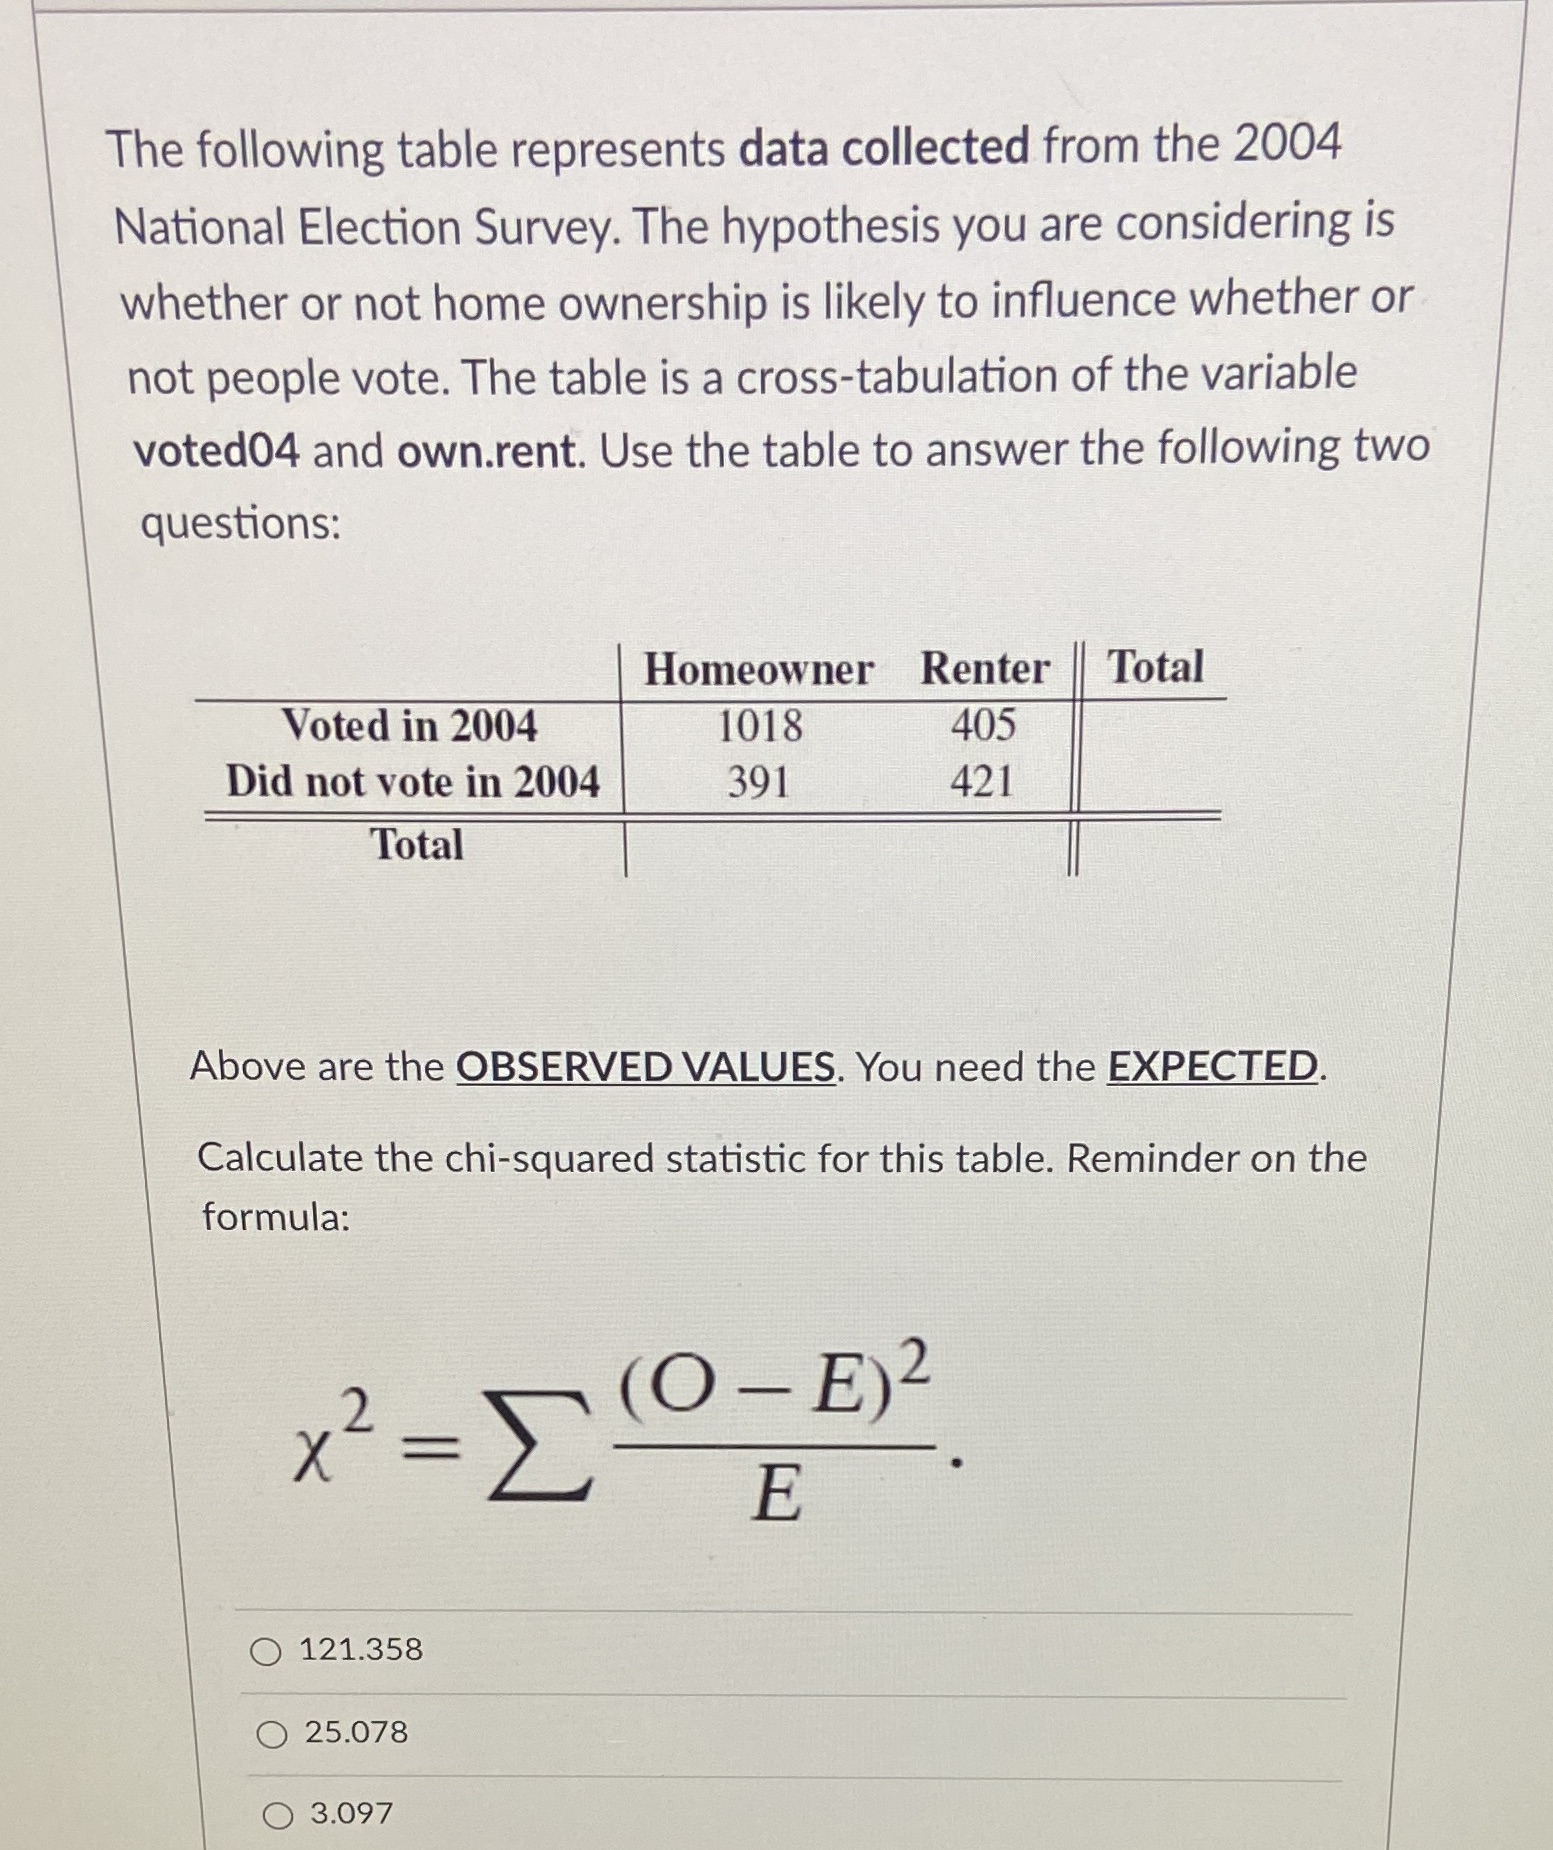
The following table represents data collected from the 2004 National Election Survey. The hypothesis you are considering is whether or not home ownership is likely to influence whether or not people vote. The table is a cross-tabulation of the variable voted04 and own.rent. Use the table to answer the following two questions: Homeowner Renter Total Voted in 2004 1018 405 Did not vote in 2004 391 421 Total Above are the OBSERVED VALUES. You need the EXPECTED. Calculate the chi-squared statistic for this table. Reminder on the formula: x2 = [ O - E) 2 E 121.358 O 25.078 3.097
Step by Step Solution
There are 3 Steps involved in it
1 Expert Approved Answer
Step: 1 Unlock

Question Has Been Solved by an Expert!
Get step-by-step solutions from verified subject matter experts
Step: 2 Unlock
Step: 3 Unlock