

Question: Help!!!! PLEASE Use the graph input tool to help you answer the following questions. You will not be graded on any changes you make to
Help!!!! PLEASE
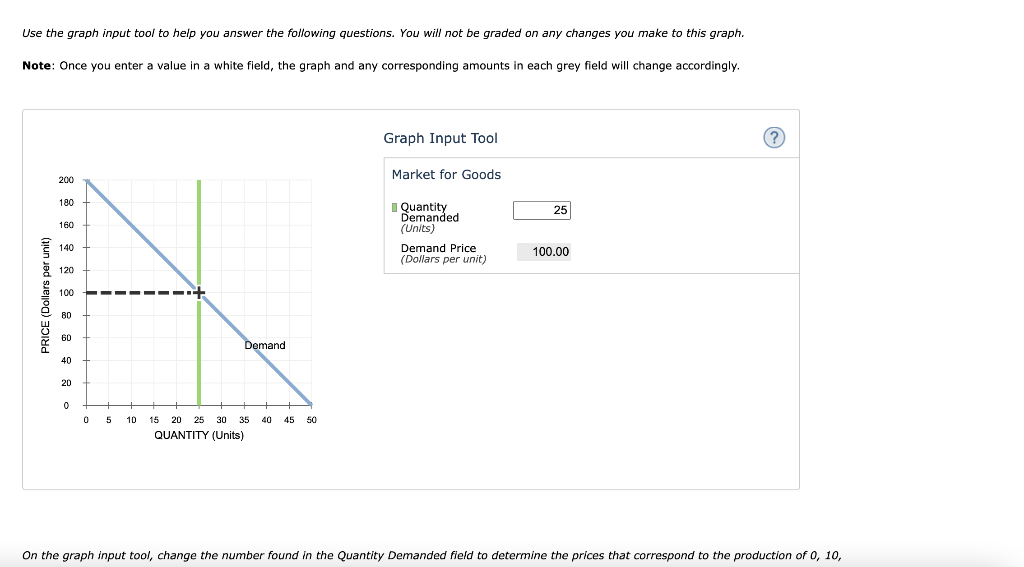
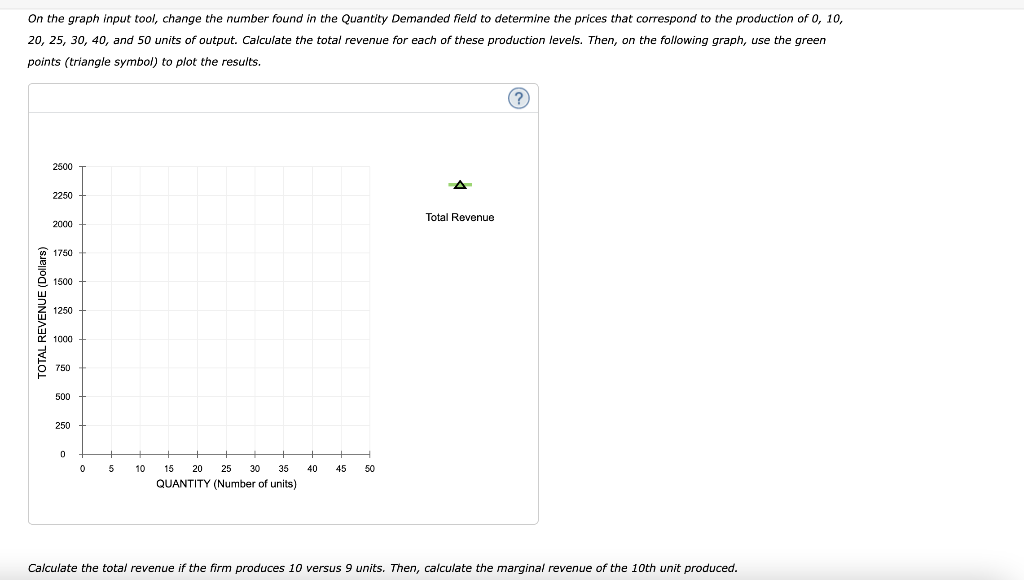
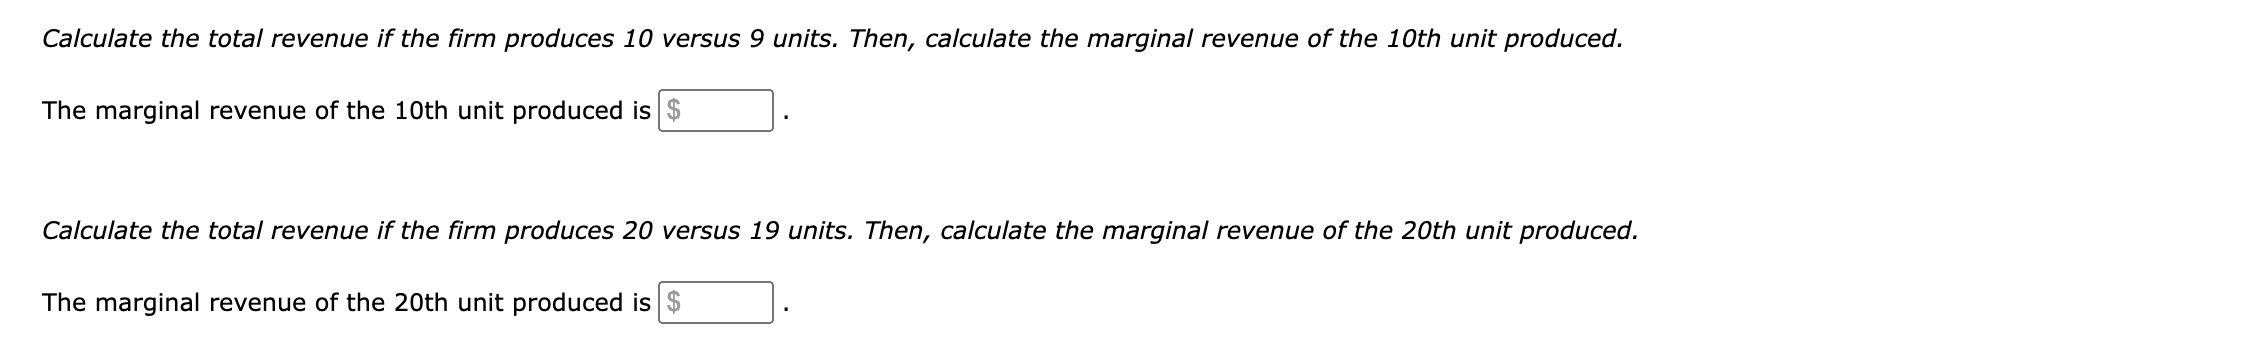
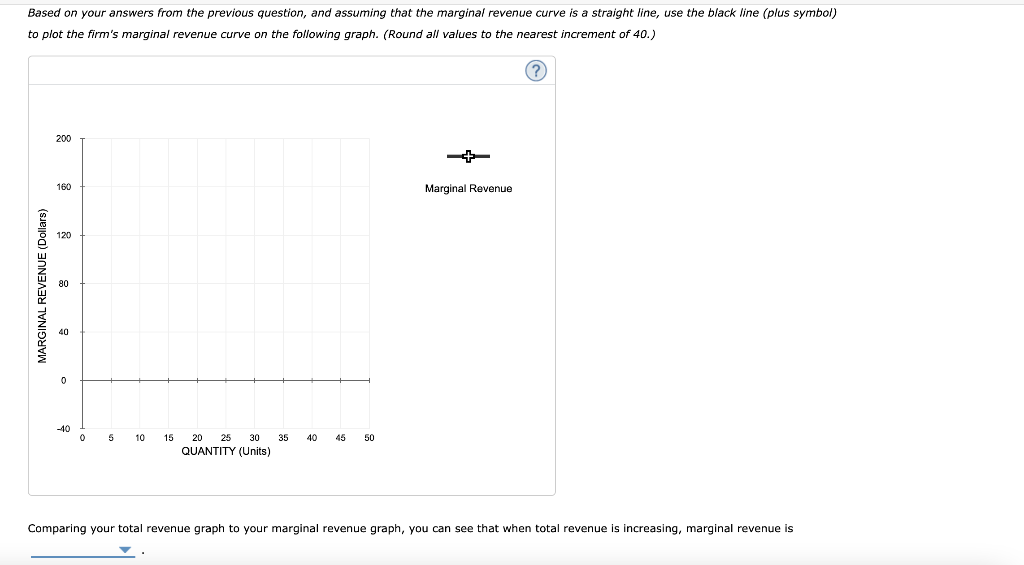
Use the graph input tool to help you answer the following questions. You will not be graded on any changes you make to this graph. Note: Once you enter a value in a white field, the graph and any corresponding amounts in each grey field will change accordingly. Graph Input Tool On the graph input tool, change the number found in the Quantity Demanded field to determine the prices that correspond to the production of 10 , 20,25,30,40, and 50 units of output. Calculate the total revenue for each of these production levels. Then, on the following graph, use the green points (triangle symbol) to plot the results. Calculate the total revenue if the firm produces 10 versus 9 units. Then, calculate the marginal revenue of the 10 th unit produced. The marginal revenue of the 10 th unit produced is Calculate the total revenue if the firm produces 20 versus 19 units. Then, calculate the marginal revenue of the 20 th unit produced. The marginal revenue of the 20 th unit produced is Based on your answers from the previous question, and assuming that the marginal revenue curve is a straight line, use the black line (plus symbol) to plot the firm's marginal revenue curve on the following graph. (Round all values to the nearest increment of 40. ) Comparing your total revenue graph to your marginal revenue graph, you can see that when total revenue is increasing, marginal revenue is Use the graph input tool to help you answer the following questions. You will not be graded on any changes you make to this graph. Note: Once you enter a value in a white field, the graph and any corresponding amounts in each grey field will change accordingly. Graph Input Tool On the graph input tool, change the number found in the Quantity Demanded field to determine the prices that correspond to the production of 10 , 20,25,30,40, and 50 units of output. Calculate the total revenue for each of these production levels. Then, on the following graph, use the green points (triangle symbol) to plot the results. Calculate the total revenue if the firm produces 10 versus 9 units. Then, calculate the marginal revenue of the 10 th unit produced. The marginal revenue of the 10 th unit produced is Calculate the total revenue if the firm produces 20 versus 19 units. Then, calculate the marginal revenue of the 20 th unit produced. The marginal revenue of the 20 th unit produced is Based on your answers from the previous question, and assuming that the marginal revenue curve is a straight line, use the black line (plus symbol) to plot the firm's marginal revenue curve on the following graph. (Round all values to the nearest increment of 40. ) Comparing your total revenue graph to your marginal revenue graph, you can see that when total revenue is increasing, marginal revenue is
Step by Step Solution
There are 3 Steps involved in it

Get step-by-step solutions from verified subject matter experts