

Question: Help please!! we are suppose to fix the errors in the code! The data is listed in the picture too. This is done in Rstudio.
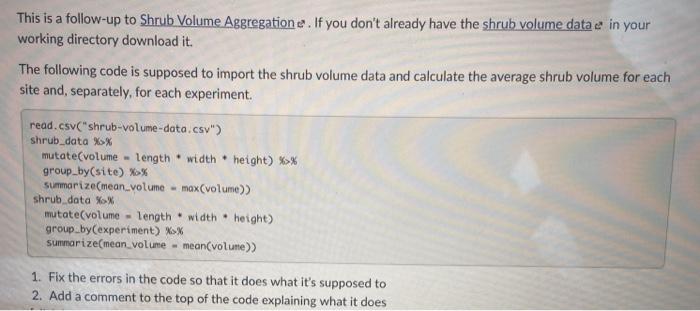
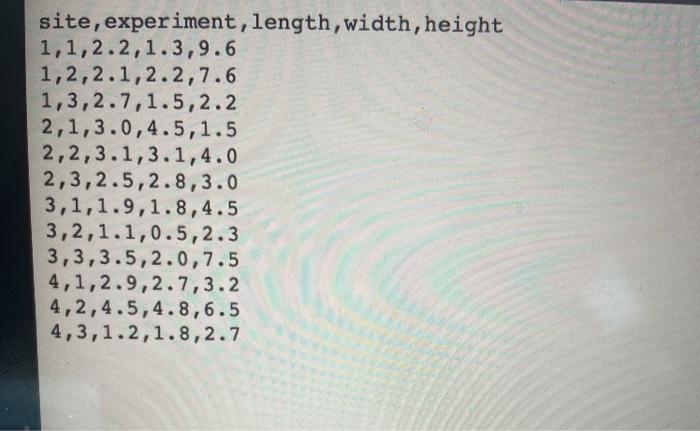
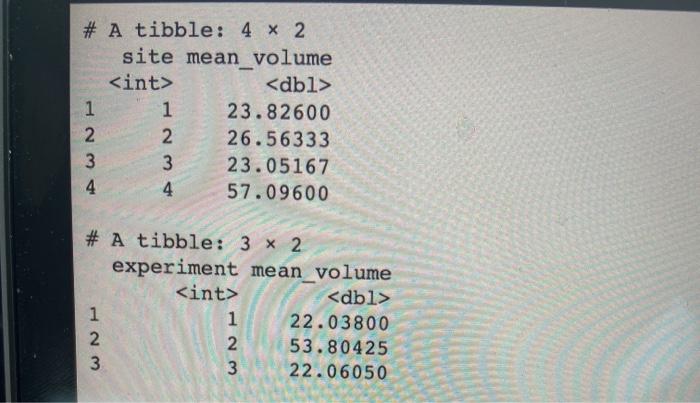
This is a follow-up to Shrub Volume Aggregatione. If you don't already have the shrub volume data e in your working directory download it. The following code is supposed to import the shrub volume data and calculate the average shrub volume for each site and, separately, for each experiment. read.csv"shrub-volume-data.csv") shrub_data%% mutate volume-length width * height) %>% group_by(site) %>% summarize(mean_volume - max(volume) shrub dota XX mutate volume - length * width * height) group_byCexperiment) XX summarize(mean_volume - mean(volume) 1. Fix the errors in the code so that it does what it's supposed to 2. Add a comment to the top of the code explaining what it does site, experiment, length, width, height 1,1,2.2,1.3,9.6 1,2,2.1,2.2,7.6 1,3,2.7,1.5, 2.2 2,1,3.0,4.5,1.5 2,2,3.1,3.1, 4.0 2,3,2.5,2.8,3.0 3,1,1.9,1.8,4.5 3,2,1.1,0.5,2.3 3,3,3.5,2.0,7.5 4,1,2.9,2.7,3.2 4,2,4.5,4.8,6.5 4,3,1.2,1.8, 2.7 # A tibble: 4 x 2 site mean_volume 1 1 23.82600 2 2 26.56333 3 23.05167 4 57.09600 # A tibble: 3 x 2 experiment mean_volume
1 1 22.03800 53.80425 22.06050 WN WN
Step by Step Solution
There are 3 Steps involved in it

Get step-by-step solutions from verified subject matter experts