

Question: Help please What's New Activity 3.5: Graphing Motion Source. Physics LP by DepEd and UP MISMED Direction: Use graph paper to plot the motion of
Help please
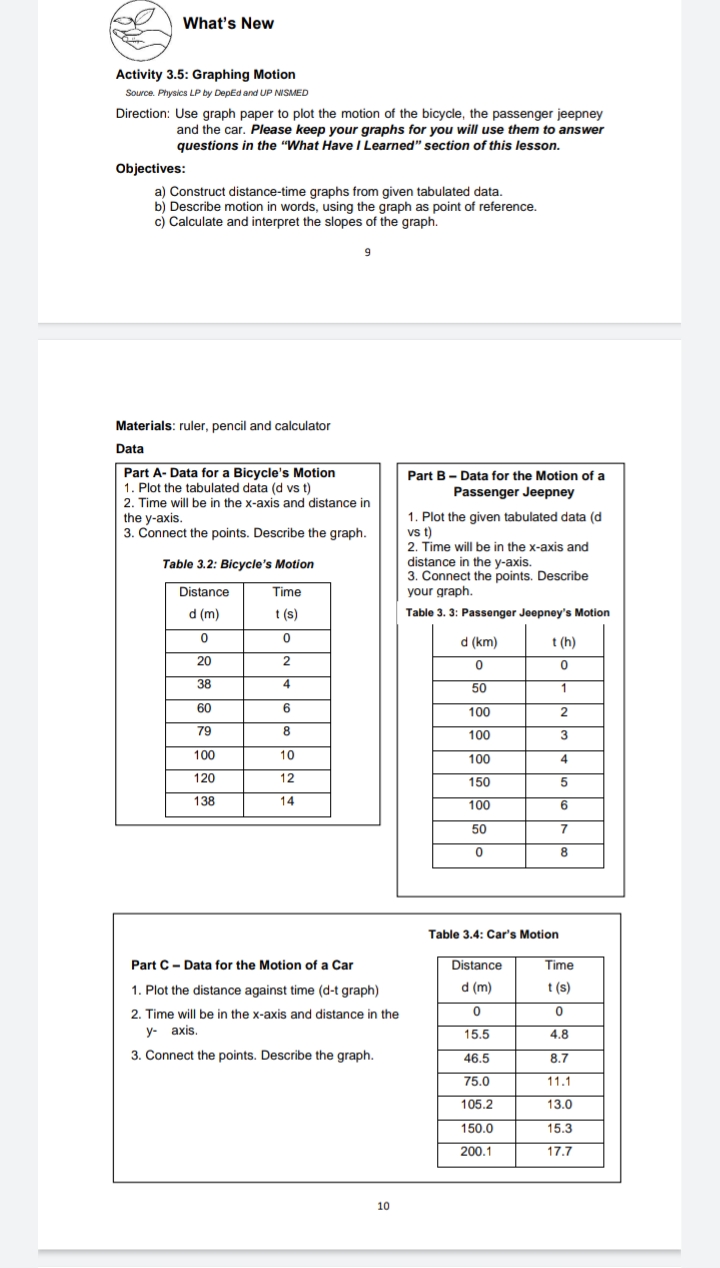
What's New Activity 3.5: Graphing Motion Source. Physics LP by DepEd and UP MISMED Direction: Use graph paper to plot the motion of the bicycle, the passenger jeepney and the car. Please keep your graphs for you will use them to answer questions in the "What Have I Learned" section of this lesson. Objectives: a) Construct distance-time graphs from given tabulated data. b) Describe motion in words, using the graph as point of reference. c) Calculate and interpret the slopes of the graph. Materials: ruler, pencil and calculator Data Part A- Data for a Bicycle's Motion Part B - Data for the Motion of a 1. Plot the tabulated data (d vs t) Passenger Jeepney 2. Time will be in the x-axis and distance in the y-axis. 1. Plot the given tabulated data (d 3. Connect the points. Describe the graph. vs t) 2. Time will be in the x-axis and Table 3.2: Bicycle's Motion distance in the y-axis. 3. Connect the points. Describe Distance Time your graph. d (m) t (s) Table 3. 3: Passenger Jeepney's Motion 0 0 d (km) t (h) 20 2 0 0 38 4 50 1 60 6 100 2 79 8 100 3 100 10 100 4 120 12 150 5 138 14 100 6 50 0 8 Table 3.4: Car's Motion Part C - Data for the Motion of a Car Distance Time 1. Plot the distance against time (d-t graph) d (m) t (s) 2. Time will be in the x-axis and distance in the 0 0 y- axis. 15.5 4.8 3. Connect the points. Describe the graph. 46.5 8.7 75.0 11.1 105.2 13.0 150.0 15.3 200.1 17.7 10
Step by Step Solution
There are 3 Steps involved in it

Get step-by-step solutions from verified subject matter experts