

Question: help pls pls help. *updated* There is needed to be security camerasta production only was recorded for as of 150ervation each, and meandroges were comid.
help pls 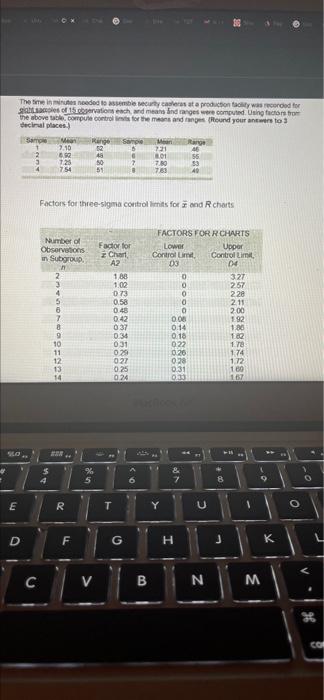
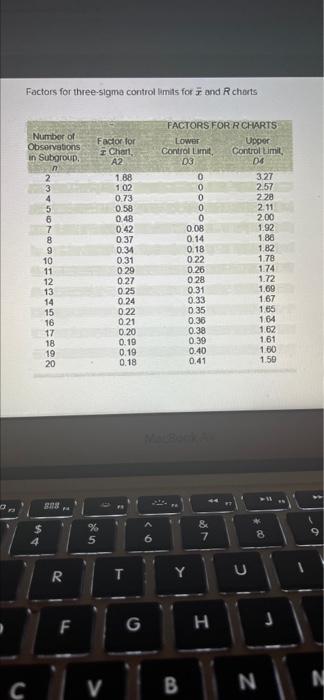
pls help. *updated* 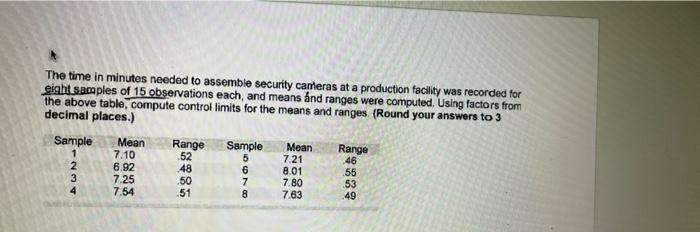
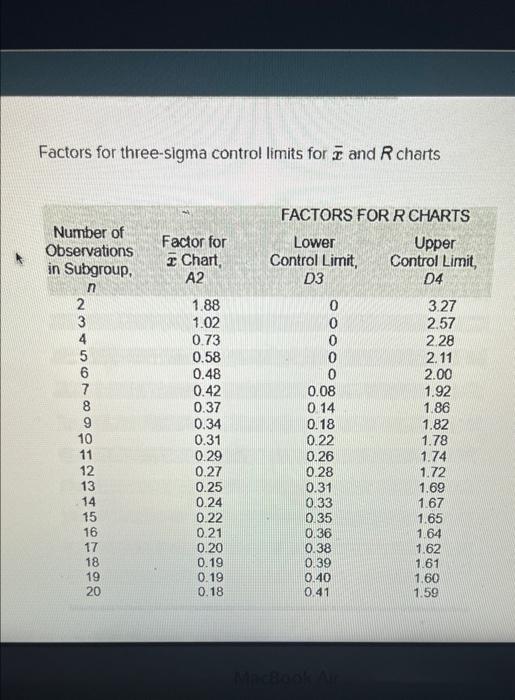
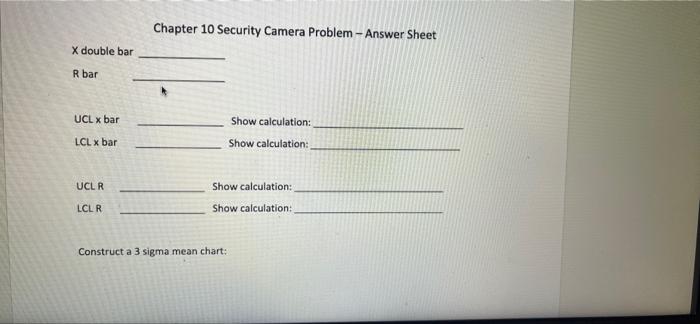
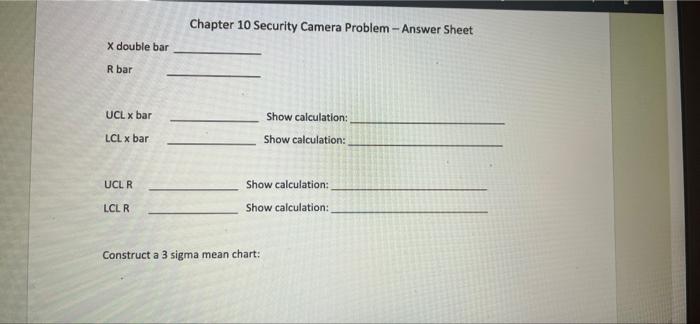
There is needed to be security camerasta production only was recorded for as of 150ervation each, and meandroges were comid. Using from the above the compute control for the means and ground your new to decimal places) Rare Sample Range 9.15 52 8 721 69 18 0.01 56 3 728 30 7 780 53 754 753 40 Factors for three-sigma controllimit for and charts Number of Observations in Subgroup Factor for Chart A2 188 1 1.02 073 2 NOD 0.58 FACTORS FOR R-CHARTS Lower Upper Control Control Limit 03 04 O 327 0 257 0 22 0 211 0 200 DO 192 0.14 1.80 0.10 182 022 1.78 0126 174 020 1.72 0.31 180 010 167 0.48 042 11 12 13 14 037 0.34 031 029 27 0.25 0.24 40 SER $ % N GO E R Y U C O D F G H K 5 C V B N M M 7 Factors for three-sigma control limits for i and R charts Number of Observations in Subgroup Factor for Chart A2 23456783%H 1.88 1.02 0.73 0.58 0.48 0.42 0.37 0.34 0.31 0.29 0.27 025 024 022 021 0.20 0.19 0.19 0.18 FACTORS FOR R CHARTS Lower Upper Control unit, Control Limit 03 04 3.27 0 2.57 0 2.28 0 2.11 0 200 0.08 1.92 0.14 1.88 0.18 1.82 0.22 1.78 0.26 1.74 028 1.72 0.31 1.09 0.33 1 85 0.36 1.64 0.38 1.62 0.39 161 0.40 1.00 0.41 1.50 10 11 12 13 14 15 16 17 18 19 20 167 0.35 $ * 18 0 % 5 & 7 . be O 6 8 T R Y Y U F G H V C N B Chapter 10 Security Camera Problem - Answer Sheet X double bar R bar UCL x bar Show calculation: LCL x bar Show calculation: UCL R Show calculation LCL R Show calculation: Construct a 3 sigma mean chart: The time in minutes needed to assemble security canteras at a production facility was recorded for eight samples of 15 observations each, and means and ranges were computed. Using factors from the above table, compute control limits for the means and ranges (Round your answers to 3 decimal places.) Sample Mean Range Sample Mean Range 7.10 5 7.21 46 2 6.92 48 8.01 55 3 7.25 50 7 7.80 53 7.54 51 7.63 49 1 .52 = 6 CD VON 4 8 Factors for three-sigma control limits for 7 and R charts Number of Observations in Subgroup. n 2 Factor for 1 Chart A2 FACTORS FOR R CHARTS Lower Upper Control Limit Control Limit D3 04 0 4 *OVOU AON 6 7 8 9 10 11 12 13 14 15 16 17 18 19 20 1.88 1.02 0.73 0.58 0.48 0.42 0.37 0.34 0.31 0.29 0.27 0.25 0.24 0.22 0.21 0.20 0.19 0.19 0.18 0 0.08 0 14 0.18 0.22 0.26 0.28 0.31 0.33 0.35 0.36 0.38 0.39 0.40 3.27 2.57 2.28 2.11 2.00 1.92 1.86 1.82 1.78 1.74 1.72 1.69 1.67 1.65 1.64 1.62 1.61 1.60 1.59 0.41 Chapter 10 Security Camera Problem - Answer Sheet X double bar R bar UCL x bar Show calculation: Show calculation: LCL x bar UCL R Show calculation: Show calculation LCLR Construct a 3 sigma mean chart
Step by Step Solution
There are 3 Steps involved in it
1 Expert Approved Answer
Step: 1 Unlock

Question Has Been Solved by an Expert!
Get step-by-step solutions from verified subject matter experts
Step: 2 Unlock
Step: 3 Unlock