

Question: help pls!! Use the data below to answer the next three questions. For the actual and forecast values shown above, compute the MAD, MSE, and
help pls!! 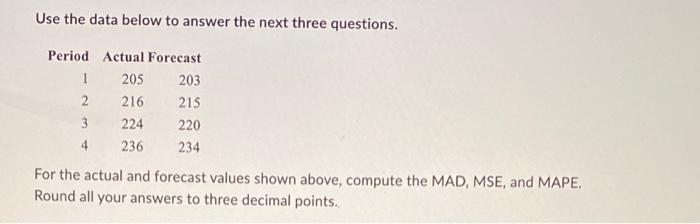
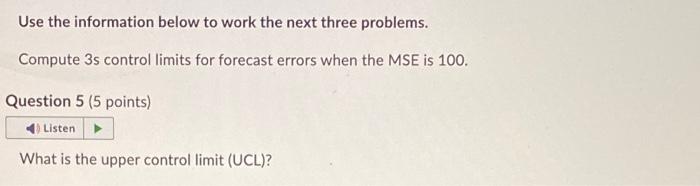
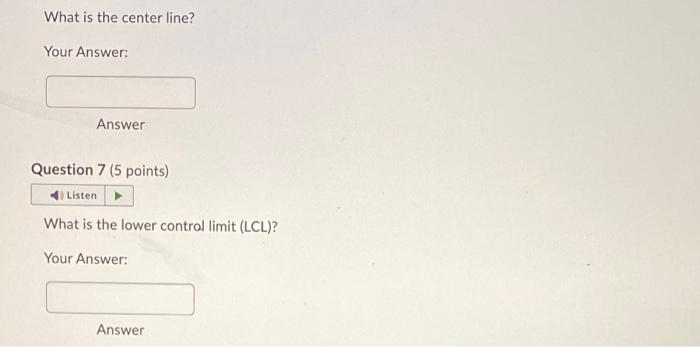
Use the data below to answer the next three questions. For the actual and forecast values shown above, compute the MAD, MSE, and MAPE. Round all your answers to three decimal points. Use the information below to work the next three problems. Compute 3 s control limits for forecast errors when the MSE is 100. Question 5 (5 points) What is the upper control limit (UCL)? What is the center line? Your Answer: Answer Question 7 (5 points) 4) Listen What is the lower control limit (LCL)? Your Step by Step Solution
There are 3 Steps involved in it
1 Expert Approved Answer
Step: 1 Unlock

Question Has Been Solved by an Expert!
Get step-by-step solutions from verified subject matter experts
Step: 2 Unlock
Step: 3 Unlock