

Question: help plsssssss 1. Income inequality and the poverty rate The following table summarizes the income distribution for the town of Perkopia, which has a population
help plsssssss


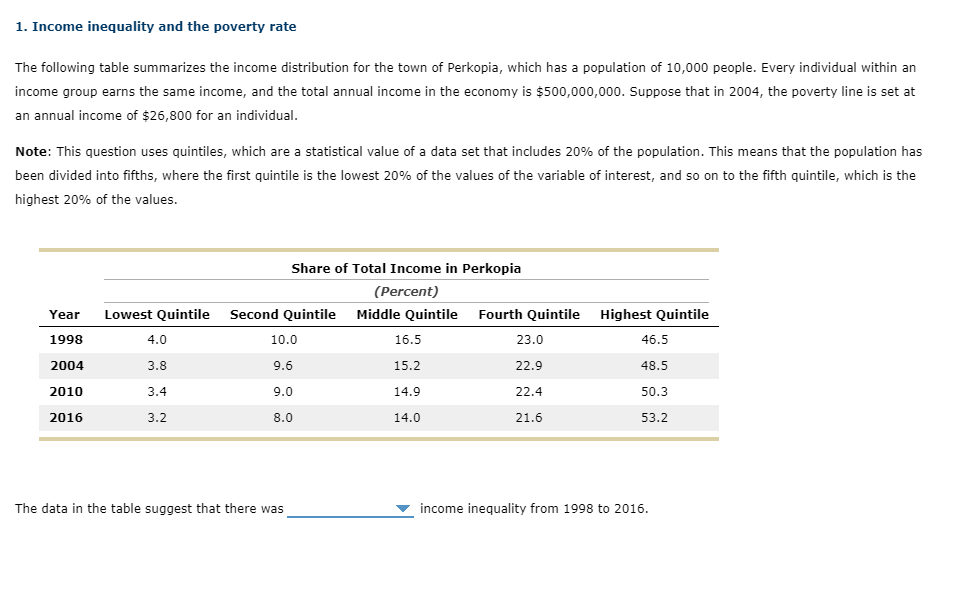
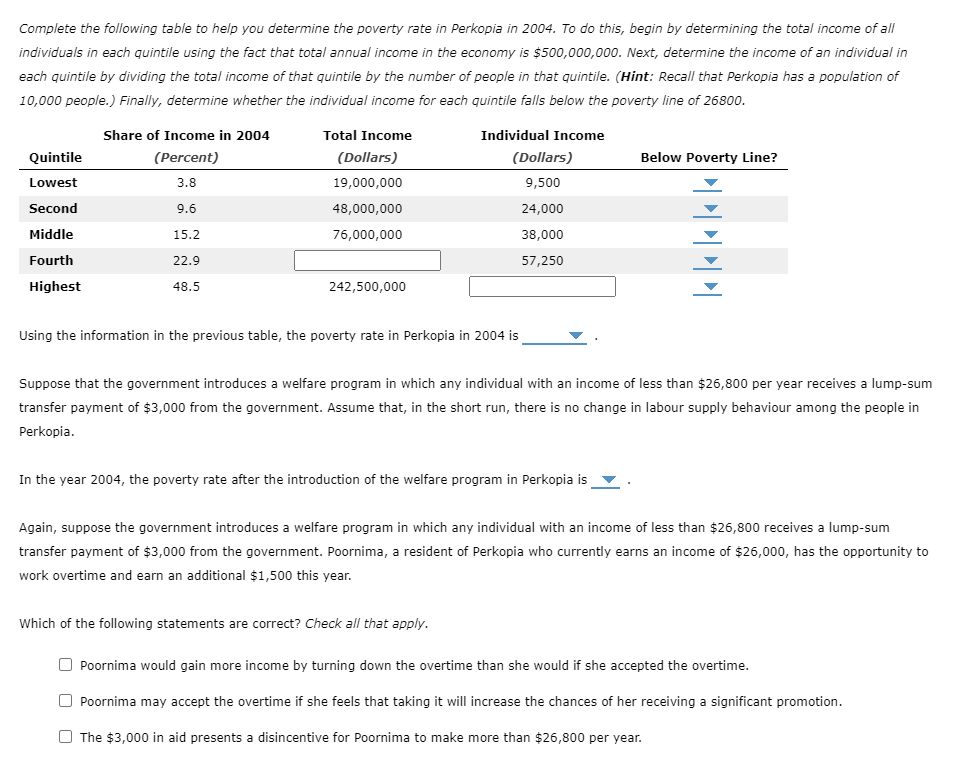
1. Income inequality and the poverty rate The following table summarizes the income distribution for the town of Perkopia, which has a population of 10,000 people. Every individual within an income group earns the same income, and the total annual income in the economy is $500,000,000. Suppose that in 2004, the poverty line is set at an annual income of $26,800 for an individual. Note: This question uses quintiles, which are a statistical value of a data set that includes 20% of the population. This means that the population has been divided into fifths, where the first quintile is the lowest 20% of the values of the variable of interest, and so on to the fifth quintile, which is the highest 20% of the values. Share of Total Income in Perkopia (Percent) Year Lowest Quintile Second Quintile Middle Quintile Fourth Quintile Highest Quintile 1998 1.0 10.0 16.5 23.0 46.5 2004 3.8 9.6 15.2 22.9 48.5 2010 3.4 9.0 14.9 22.4 50.3 2016 3.2 8.0 14.0 21.6 53.2 The data in the table suggest that there was income inequality from 1998 to 2016.Complete the following table to help you detenhine the poverty rate in Perkopia in 2004. To do this, begin by determining the total income of all indivrduals in each quintile using the fact that total annual income in the economy is $500,000,000. Next, determine the income of an individual in each quintiie by dividing the total income of that quintile by the number of people in that guintile. (Hint: Recall that Rarlcopia has a population of 10,000 people.) Finally, determine whether the individual income for each quintile falls below the poverty line of 26800. Share of Income in 2004 Total Income Individual Income Quintile (Percent) (Dollars) (Dollars) Below Poverty Ijne? Lowest 3.3 10,000,000 9,500 Second 9.6 40,000,000 24,000 Middle 15.2 36,000,000 30,000 Highest 43.5 242,500,000 |:| Using the information in the previous table, the poverty rate in Perkopia in 2004 is V . it it l
Step by Step Solution
There are 3 Steps involved in it

Get step-by-step solutions from verified subject matter experts