

Question: help! presentsed below are the 2021 income statement and comparative balance sheets for Santana industries. sales revenue $17650 ome statement and comparative balance sheets for
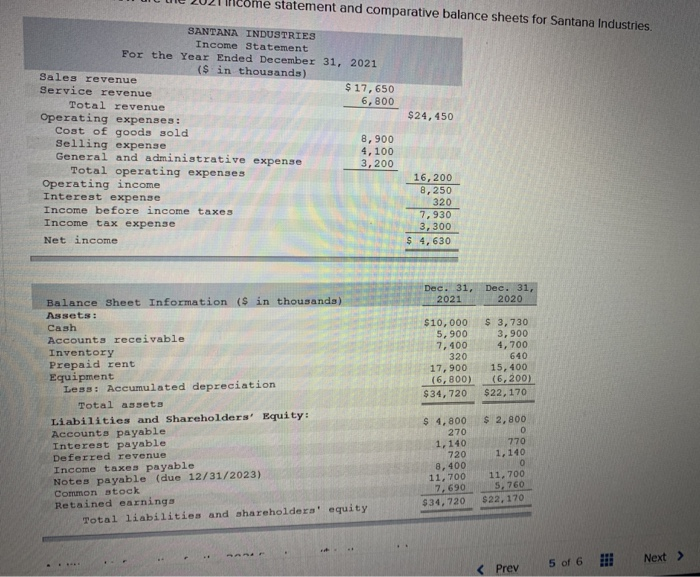
ome statement and comparative balance sheets for Santana Industries $24,450 SANTANA INDUSTRIES Income Statement For the Year Ended December 31, 2021 ($ in thousands) Sales revenue $ 17,650 Service revenue 6,800 Total revenue Operating expenses: Coat of goods sold 8, 900 Selling expense 4,100 General and administrative expense 3,200 Total operating expenses Operating income Interest expense Income before income taxes Income tax expense Net income 16,200 8,250 320 7,930 3,300 $ 4,630 Dec. 31, Dec. 31, 2021 2020 $10,000 5,900 7.100 320 17,900 (6, 800) $34, 720 $ 3,730 3,900 4,700 640 15,400 (6,200) $22,170 Balance sheet Information ($ in thousands) Assets: Cash Accounts receivable Inventory Prepaid rent Equipment Less: Accumulated depreciation Total assets Liabilities and shareholders' Equity: Accounts payable Interest payable Deferred revenue Income taxes payable Notes payable (due 12/31/2023) Common stock Retained earnings Total liabilities and shareholders' equity $ 4,800 270 1,140 720 8, 400 11,700 7,690 $34, 720 $ 2,800 0 770 1,140 0 11,700 5,760 $22,170 5 of 6 Next >
Step by Step Solution
There are 3 Steps involved in it

Get step-by-step solutions from verified subject matter experts