

Question: Help project 8:41 f . 11 46 100 Edit 28 3 X Performance Task for Statistics and Probability Make an analysis of the table below.
Help project
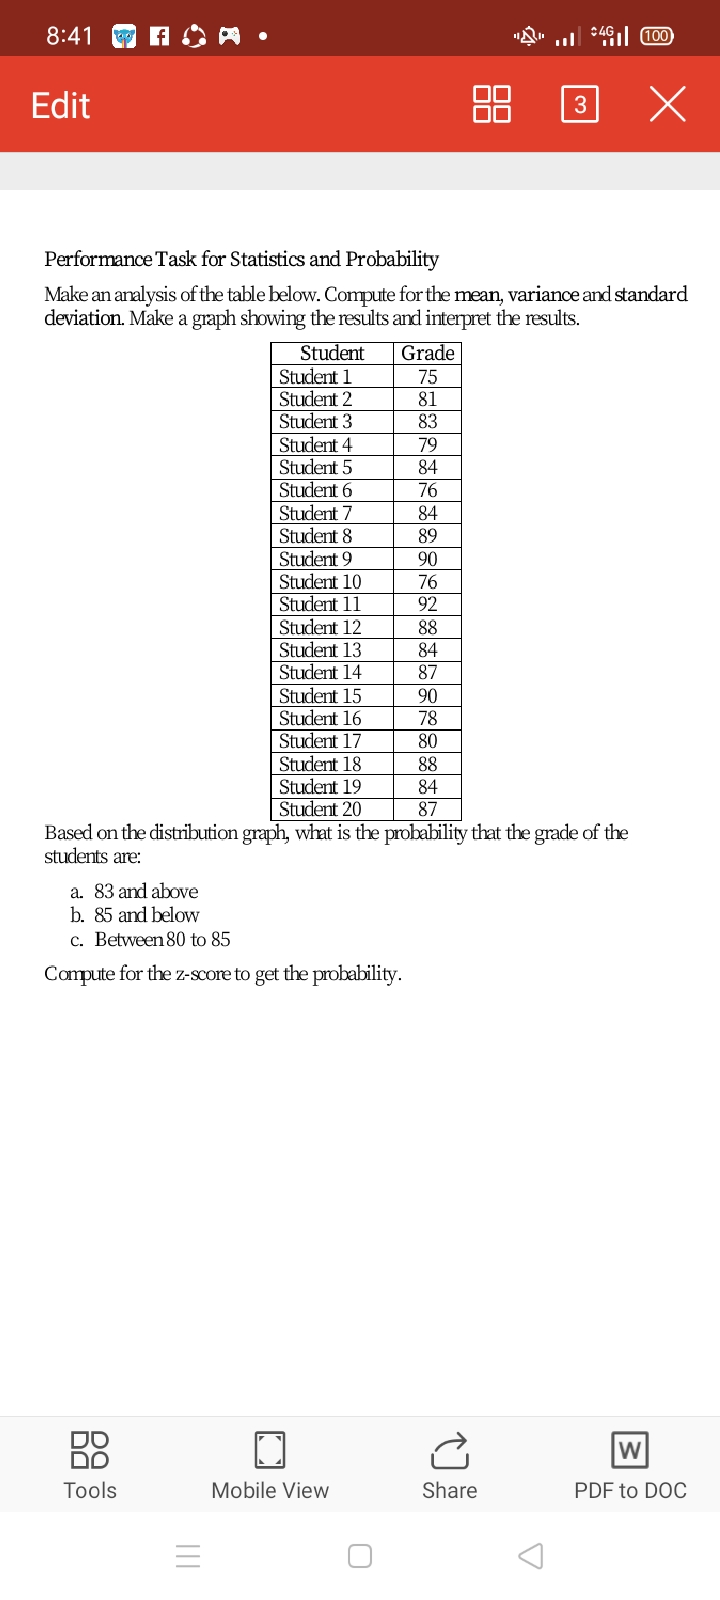
8:41 f . 11 46 100 Edit 28 3 X Performance Task for Statistics and Probability Make an analysis of the table below. Compute for the mean, variance and standard deviation. Make a graph showing the results and interpret the results. Student Grade Student 1 75 Student 2 81 Student 3 83 Student 4 79 Student 5 84 Student 6 76 Student 7 84 Student 8 39 Student 9 90 Student 10 76 Student 11 92 Student 12 88 Student 13 84 Student 14 87 Student 15 90 Student 16 78 Student 17 80 Student 18 88 Student 19 34 Student 20 87 Based on the distribution graph, what is the probability that the grade of the students are: a. 83 and above b. 85 and below c. Between 80 to 85 Compute for the z-score to get the probability. DO DO W Tools Mobile View Share PDF to DOC E O
Step by Step Solution
There are 3 Steps involved in it

Get step-by-step solutions from verified subject matter experts