

Question: Help requested on finding r. Thanks. Chrome File Edit View History Bookmarks Profiles Tab Window Help 90720 Tue mylab.pearson.com/Student/PlayerHomework.aspx?homeworkid=618602482&questionld=B&flushed=false&cld=6843907&back=DoAssignments.aspx *: Apps G Gmail BY Maps
Help requested on finding r. Thanks.
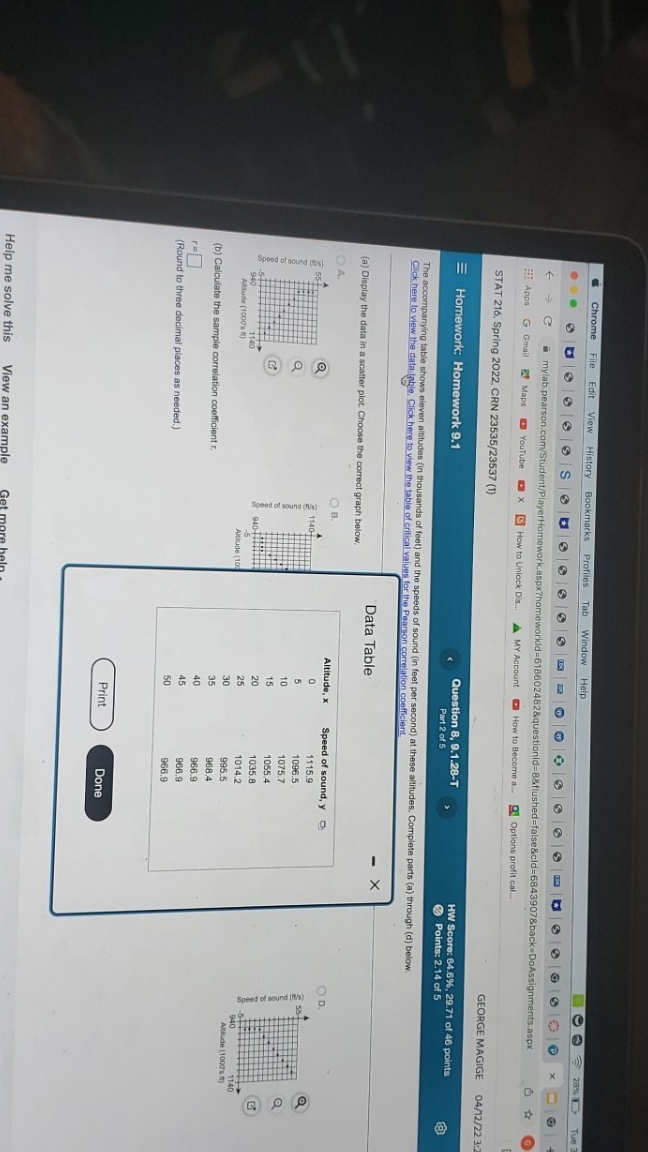
Chrome File Edit View History Bookmarks Profiles Tab Window Help 90720 Tue mylab.pearson.com/Student/PlayerHomework.aspx?homeworkid=618602482&questionld=B&flushed=false&cld=6843907&back=DoAssignments.aspx *: Apps G Gmail BY Maps Youtube X ( How to Unlock Dis... & MY Account . How to Become a... 9 Options profit cal. STAT 216, Spring 2022. CRN 23535/23537 (1) GEORGE MAGIGE 04/12/22 3: Homework: Homework 9.1 Question 8, 9.1.28-T HW Score: 64.6%, 29.71 of 46 points Part 2 of 5 Points: 2.14 of 5 The accompanying table shows eleven altitudes (in thousands of feet) and the speeds of sound (in feet per second) at these altitudes, Complete parts (a) through (d) below. Click here to view the data table. Click here to view the table of critical values for the Pearson correlation coefficient X Data Table (a) Display the data in a scatter plot. Choose the correct graph below. OA. 0 B. Altitude, x Speed of sound, y OD. 1115.9 $ 1140- 1096.5 1) punos nos jo 1075.7 (syul punos po poads 1055.4 20 1035.8 940 1140 -5 25 940 Altbuda (1000's #) Alltude [108 1014.2 M140 30 995.5 Annude (1000's (b) Calculate the sample correlation coefficient r. 35 968.4 40 966.9 45 966.9 (Round to three decimal places as needed.) 50 956.9 Print Done Help me solve this View an
Step by Step Solution
There are 3 Steps involved in it

Get step-by-step solutions from verified subject matter experts