

Question: Help Save & Exit Submit The following payoff matrix shows the various profit outcomes for 3 projects, A, B, and C, under 2 possible
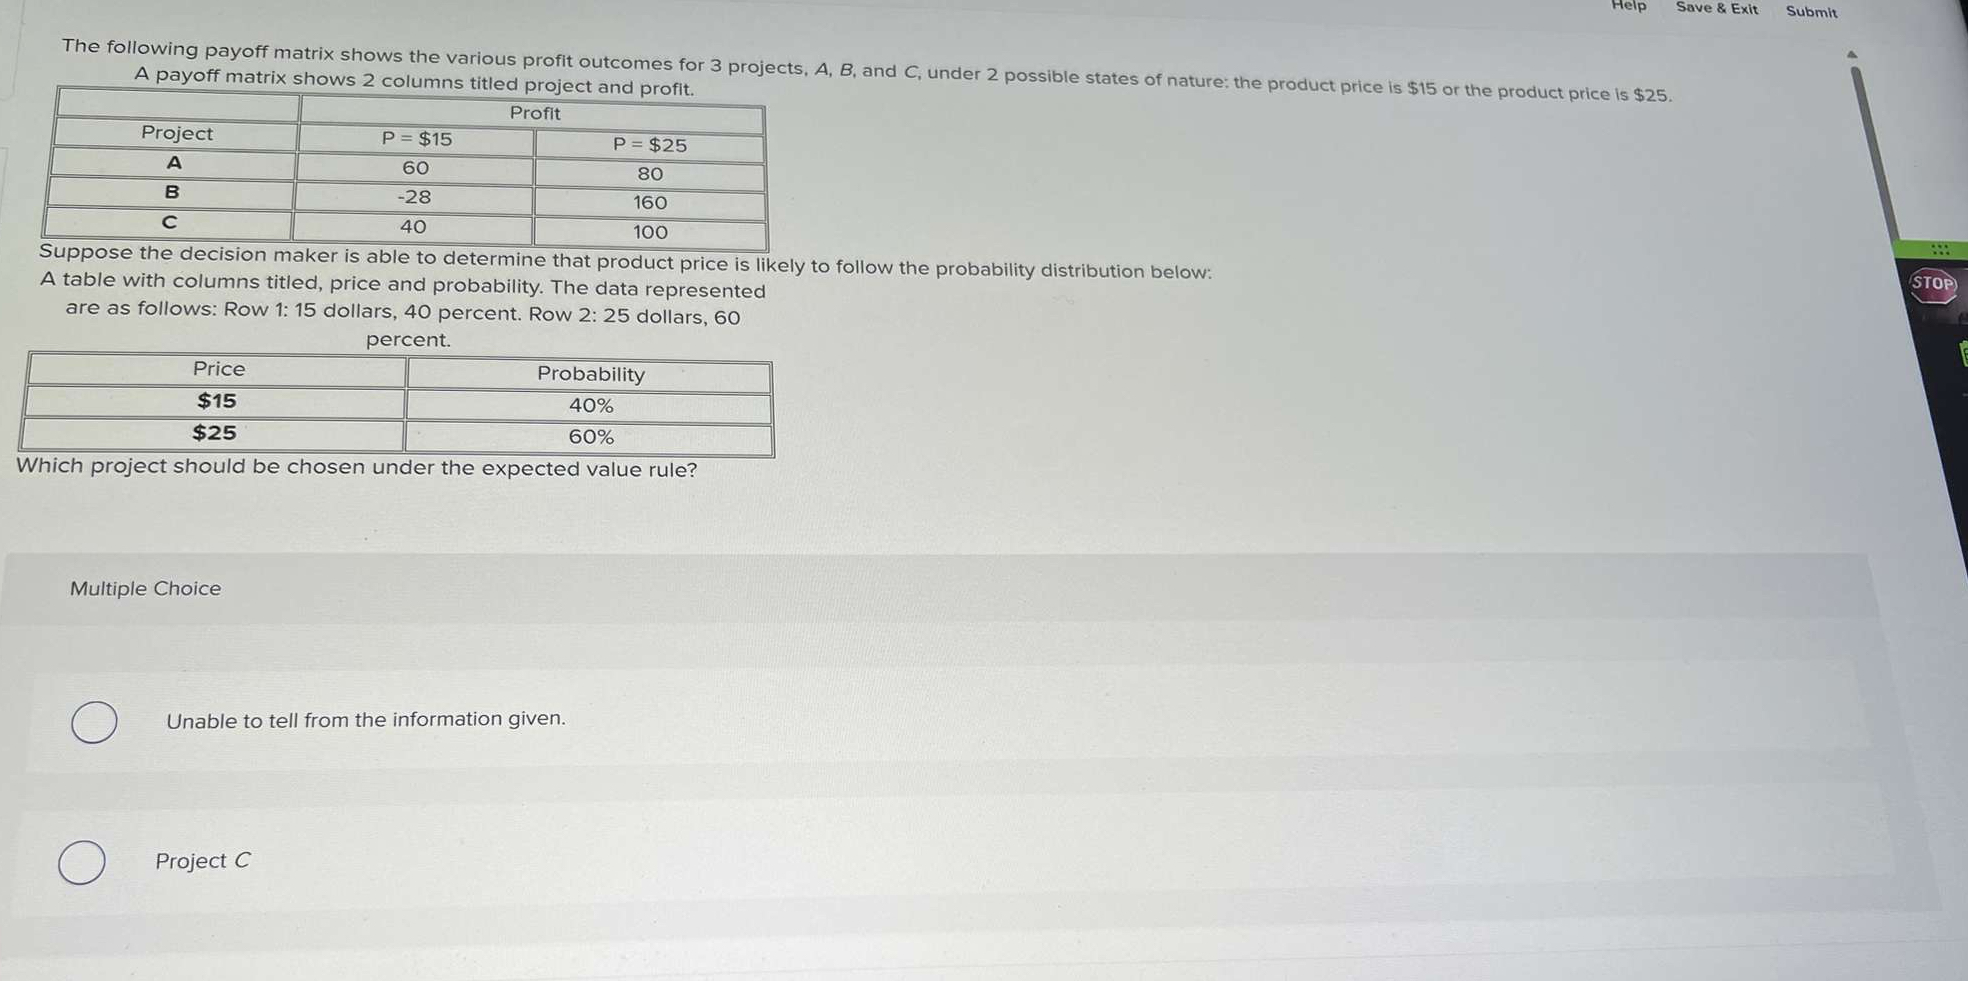
Help Save & Exit Submit The following payoff matrix shows the various profit outcomes for 3 projects, A, B, and C, under 2 possible states of nature: the product price is $15 or the product price is $25. A payoff matrix shows 2 columns titled project and profit. Project A B C P = $15 60 -28 40 Profit P = $25 80 160 100 Suppose the decision maker is able to determine that product price is likely to follow the probability distribution below: A table with columns titled, price and probability. The data represented are as follows: Row 1: 15 dollars, 40 percent. Row 2: 25 dollars, 60 Price $15 $25 percent. Probability 40% 60% Which project should be chosen under the expected value rule? Multiple Choice Unable to tell from the information given. Project C STOP
Step by Step Solution
There are 3 Steps involved in it

Get step-by-step solutions from verified subject matter experts