

Question: Help select best answer You own a bakery and decide to compare your weekly flour consumption in pounds (x - input variable) and the sales
Help select best answer
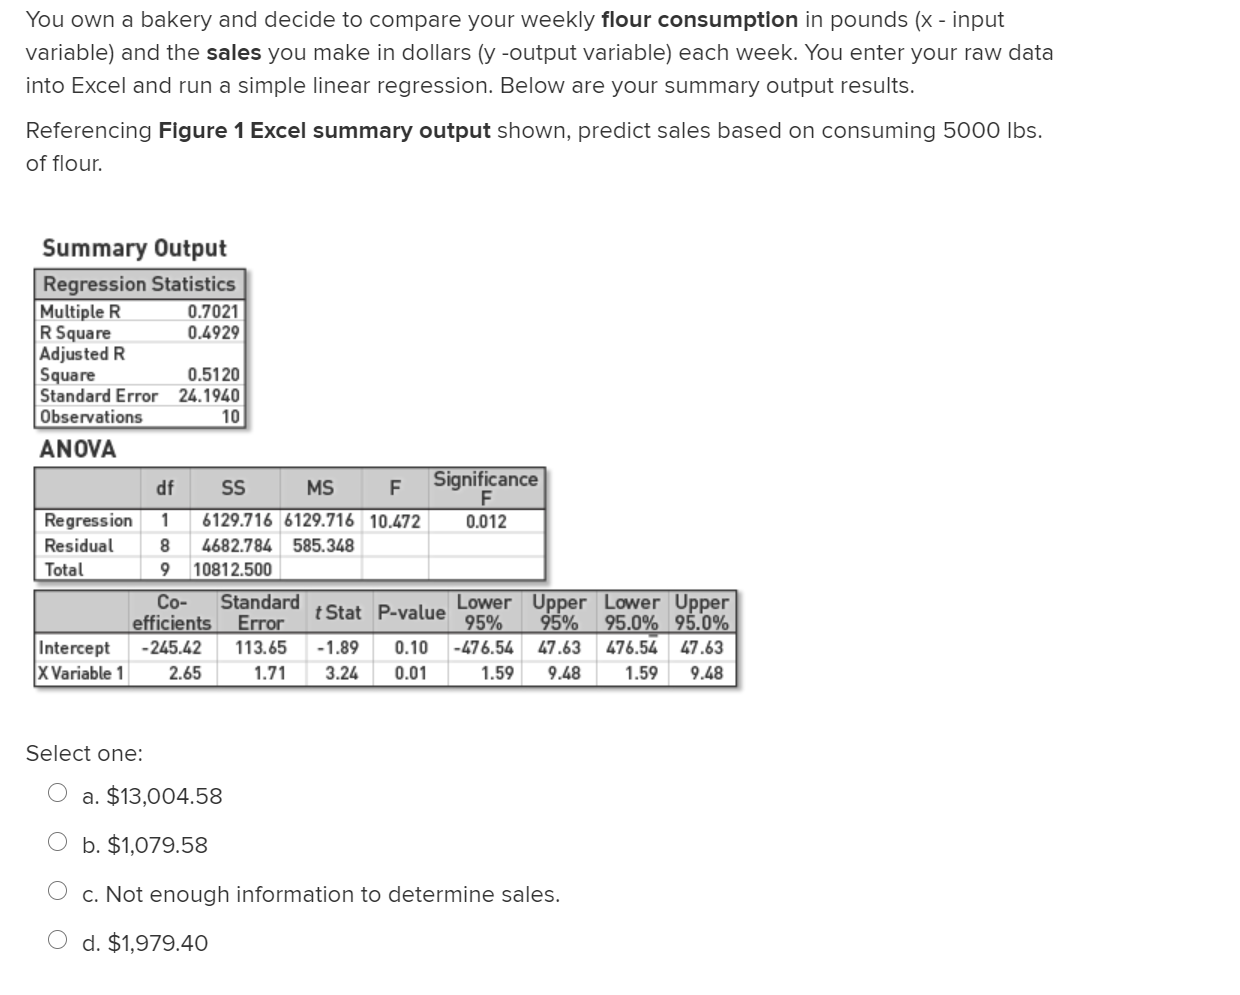
You own a bakery and decide to compare your weekly flour consumption in pounds (x - input variable) and the sales you make in dollars (y -output variable) each week. You enter your raw data into Excel and run a simple linear regression. Below are your summary output results. Referencing Figure 1 Excel summary output shown, predict sales based on consuming 5000 lbs. of flour. Summary Output Regression Statistics Multiple R 0.7021 R Square 0.4929 Adjusted R Square 0.5120 Standard Error 24.1940 Observations 10 ANOVA df SS MS F Significance F Regression 1 6129.716 6129.716 10.472 0.012 Residual CO 4682.784 585.348 Total 10812.500 Co- Standard efficients Error t Stat P-value Lower Upper Lower Upper 95% 95% 95.0% 95.0% Intercept -245.42 113.65 -1.89 0.10 -476.54 47.63 476.54 47.63 X Variable 1 2.65 1.71 3.24 0.01 1.59 87'6 1.59 87'6 Select one: O a. $13,004.58 O b. $1,079.58 O c. Not enough information to determine sales. O d. $1,979.40
Step by Step Solution
There are 3 Steps involved in it

Get step-by-step solutions from verified subject matter experts