

Question: Help solve also explain step-by-step how to set up the single linkage cluster in Excel. Cluster Analysis 1. (25 points) Apply single linkage cluster analysis
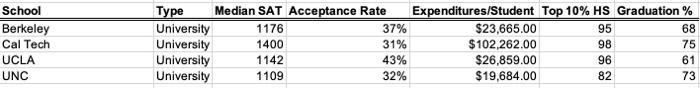
Cluster Analysis 1. (25 points) Apply single linkage cluster analysis to Berkeley, Cal Tech, UCLA, and UNC in the Excel file Colleges and Universities Cluster Analysis Worksheet and draw a dendrogram illustrating the clustering process. \begin{tabular}{|l|l|r|r|r|r|r|} \hline School & Type & Median SAT & Acceptance Rate & Expenditures/Student & Top 10\% HS & Graduation \% \\ \hline \hline Berkeley & University & 1176 & 37% & $23,665.00 & 95 & 68 \\ \hline Cal Tech & University & 1400 & 31% & $102,262.00 & 98 & 75 \\ \hline UCLA & University & 1142 & 43% & $26,859.00 & 96 & 61 \\ \hline UNC & University & 1109 & 32% & $19,684.00 & 82 & 73 \\ \hline \end{tabular}
Step by Step Solution
There are 3 Steps involved in it

Get step-by-step solutions from verified subject matter experts