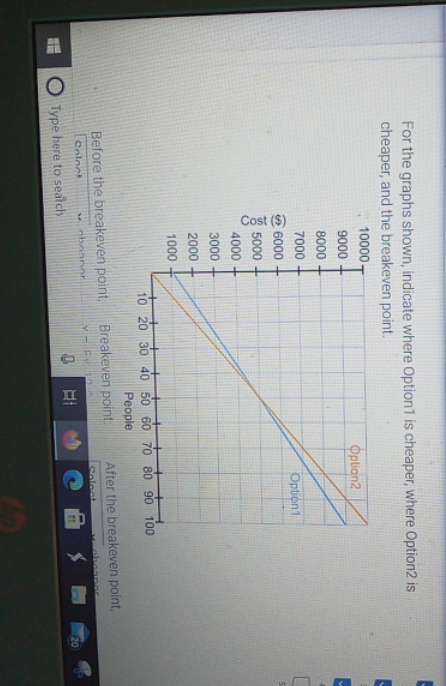
Question: help solve For the graphs shown, indicate where Option1 is cheaper, where Option2 is cheaper, and the breakeven point. 10000 9000 . Option2 8000 7000

help solve

help solve For the graphs shown, indicate where
For the graphs shown, indicate where Option1 is cheaper, where Option2 is cheaper, and the breakeven point. 10000 9000 . Option2 8000 7000 Option1 6000 Cost ($) 5000 4000 3000 2000 1000 10 20 30 40 50 60 70 80 90 100 People Before the breakeven point, Breakeven point After the breakeven point, O Type here to search 20

Step by Step Solution

There are 3 Steps involved in it

1 Expert Approved Answer
Step: 1 Unlock blur-text-image
Question Has Been Solved by an Expert!

Get step-by-step solutions from verified subject matter experts

Step: 2 Unlock
Step: 3 Unlock

Students Have Also Explored These Related Mathematics Questions!