

Question: help The following featterplot shows the mean annaal carbon dioude (CO2) in parts per milton (peri) measured at the top of a mountan and the
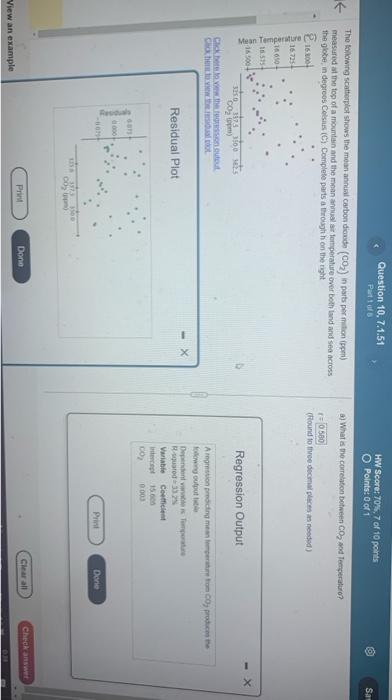
The following featterplot shows the mean annaal carbon dioude (CO2) in parts per milton (peri) measured at the top of a mountan and the moan annual ar fenperature over both land and seo across a) What a the correhtoo botseen CO2 asd Tenperatiro? the globe, in degroos Celsas (C). Complete parts a trought h on the right (Found to three decrial pleces as neodid) Regression Output Residual Plot View an example The following featterplot shows the mean annaal carbon dioude (CO2) in parts per milton (peri) measured at the top of a mountan and the moan annual ar fenperature over both land and seo across a) What a the correhtoo botseen CO2 asd Tenperatiro? the globe, in degroos Celsas (C). Complete parts a trought h on the right (Found to three decrial pleces as neodid) Regression Output Residual Plot View an example
Step by Step Solution
There are 3 Steps involved in it

Get step-by-step solutions from verified subject matter experts