

Question: HELP! this is the third time ive posted this same problem and no one has been able to correctly help me. This is the entire
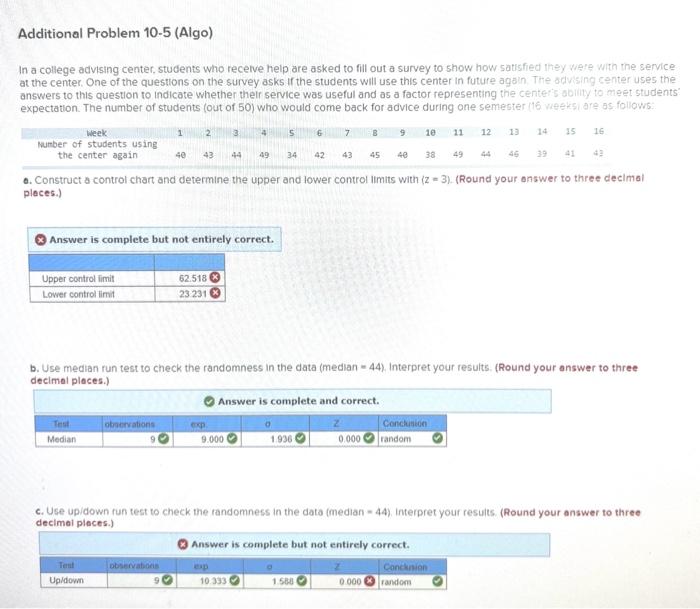
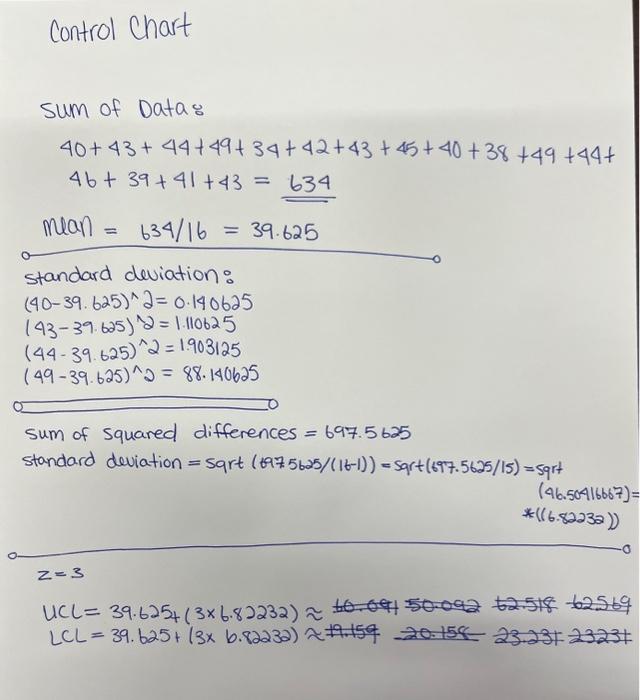
In a college advising center, students who recelve help are asked to fill out a survey to show how satisfied they were with the service at the center. One of the questions on the survey asks if the students will use this center in future agoin. The odvising center uses the answers to this question to indicate whether their service was useful and as a factor representing the centeris ability to meet students expectation. The number of students (out of 50 ) who would come back for advice during one semester (16 veeksi are as follows. Q. Construct a control chart and determine the upper and lower control limits with ( z=3 ). (Round your onswer to three decimal pleces.) Answer is complete but not entirely correct. b. Use median run test to check the randomness in the data (median = 44). Interpret your results. (Round your answer to three decimal places.) Answer is complete and correct. c. Use upidown run test to check the randomness in the data (median = 44). interpret your resuits. (Round your answer to three decimel pieces.) Control Chart sum of Data: 40+43+44+49+34+42+43+45+40+38+49+44+46+39+41+43=634mean=634/16=39.625 standard deviation: (4039.625)2=0.140625(4339.625)2=1.110625(4439.625)2=1.903125(4939.625)2=88.140625 sum of squared differences =697.5625 standarddeviation=sqrt(697.5625/(161))=sgrt(697.5625/15)=59rt(46.50416667)=((6.82232)) z=3UCL=39.625+(36.82232)50.092+2.51862.569LCL=39.625+(36.82232)15920.15823.23+23231
Step by Step Solution
There are 3 Steps involved in it

Get step-by-step solutions from verified subject matter experts