

Question: Help this Question.. thanks QUESTION 2 a) The following table shows the quantity demanded and supplied for Good T and U of a country at
Help this Question.. thanks
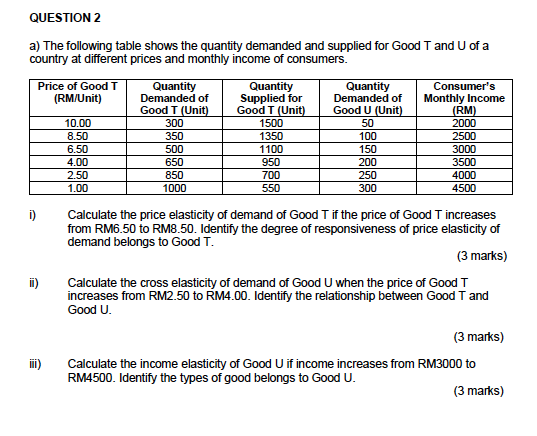
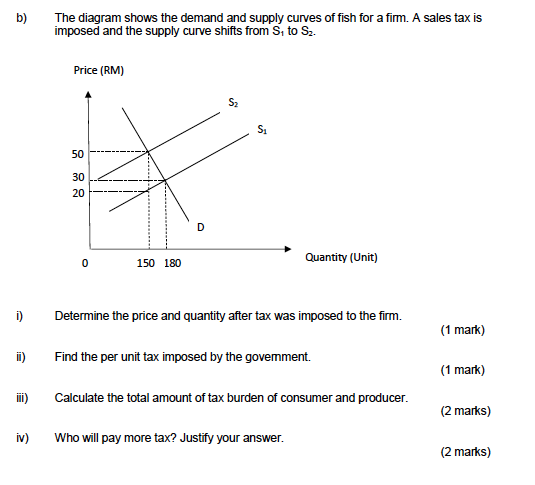
QUESTION 2 a) The following table shows the quantity demanded and supplied for Good T and U of a country at different prices and monthly income of consumers. Price of Good T Quantity Quantity Quantity Consumer's (RM/Unit) Demanded of Supplied for Demanded of Monthly Income Good T (Unit Good T (Unit] Good U (Unit) RM 10.00 300 1500 50 2000 8.50 350 1350 100 2500 6.50 500 1100 150 3000 4.00 650 350 200 3500 2.50 850 700 250 4000 1.00 1000 550 300 4500 Calculate the price elasticity of demand of Good T if the price of Good T increases from RM6.50 to RM8.50. Identify the degree of responsiveness of price elasticity of demand belongs to Good T. (3 marks) ii) Calculate the cross elasticity of demand of Good U when the price of Good T increases from RM2.50 to RM4.00. Identify the relationship between Good T and Good U. (3 marks) Calculate the income elasticity of Good U if income increases from RM3000 to RM4500. Identify the types of good belongs to Good U. (3 marks)b) The diagram shows the demand and supply curves of fish for a firm. A sales tax is imposed and the supply curve shifts from S, to S2. Price (RM) 51 50 30 20 D 0 150 180 Quantity (Unit) Determine the price and quantity after tax was imposed to the firm. (1 mark) Find the per unit tax imposed by the government. (1 mark) Calculate the total amount of tax burden of consumer and producer. (2 marks) iv) Who will pay more tax? Justify your answer. (2 marks)
Step by Step Solution
There are 3 Steps involved in it

Get step-by-step solutions from verified subject matter experts