

Question: help urgently Subsequent to a Monte Carlo simulation, the gradient (m) and vertical intercept (c) from scatter plots between the dependent variable NPV and independent
help urgently 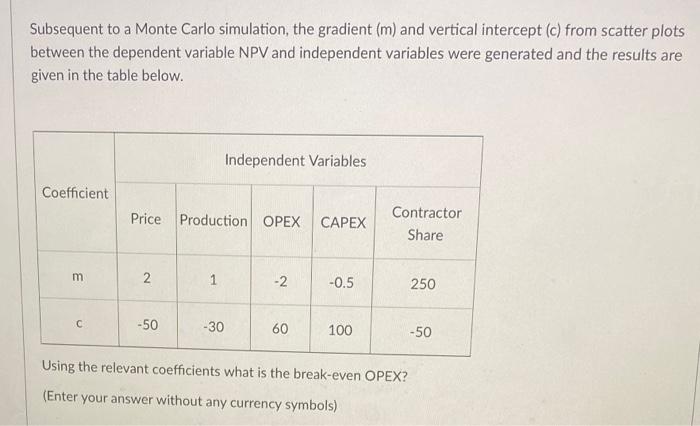
Subsequent to a Monte Carlo simulation, the gradient (m) and vertical intercept (c) from scatter plots between the dependent variable NPV and independent variables were generated and the results are given in the table below. Using the relevant coefficients what is the break-even OPEX? (Enter your answer without any currency symbols)
Step by Step Solution
There are 3 Steps involved in it
1 Expert Approved Answer
Step: 1 Unlock

Question Has Been Solved by an Expert!
Get step-by-step solutions from verified subject matter experts
Step: 2 Unlock
Step: 3 Unlock