

Question: help w/ 2 this is everything on my screen. nothing is missing 2 Given the following diagram: Monopoly ...Regular 10 . GRAPH points -Monopoly Monopoly
help w/ 2 this is everything on my screen. nothing is missing
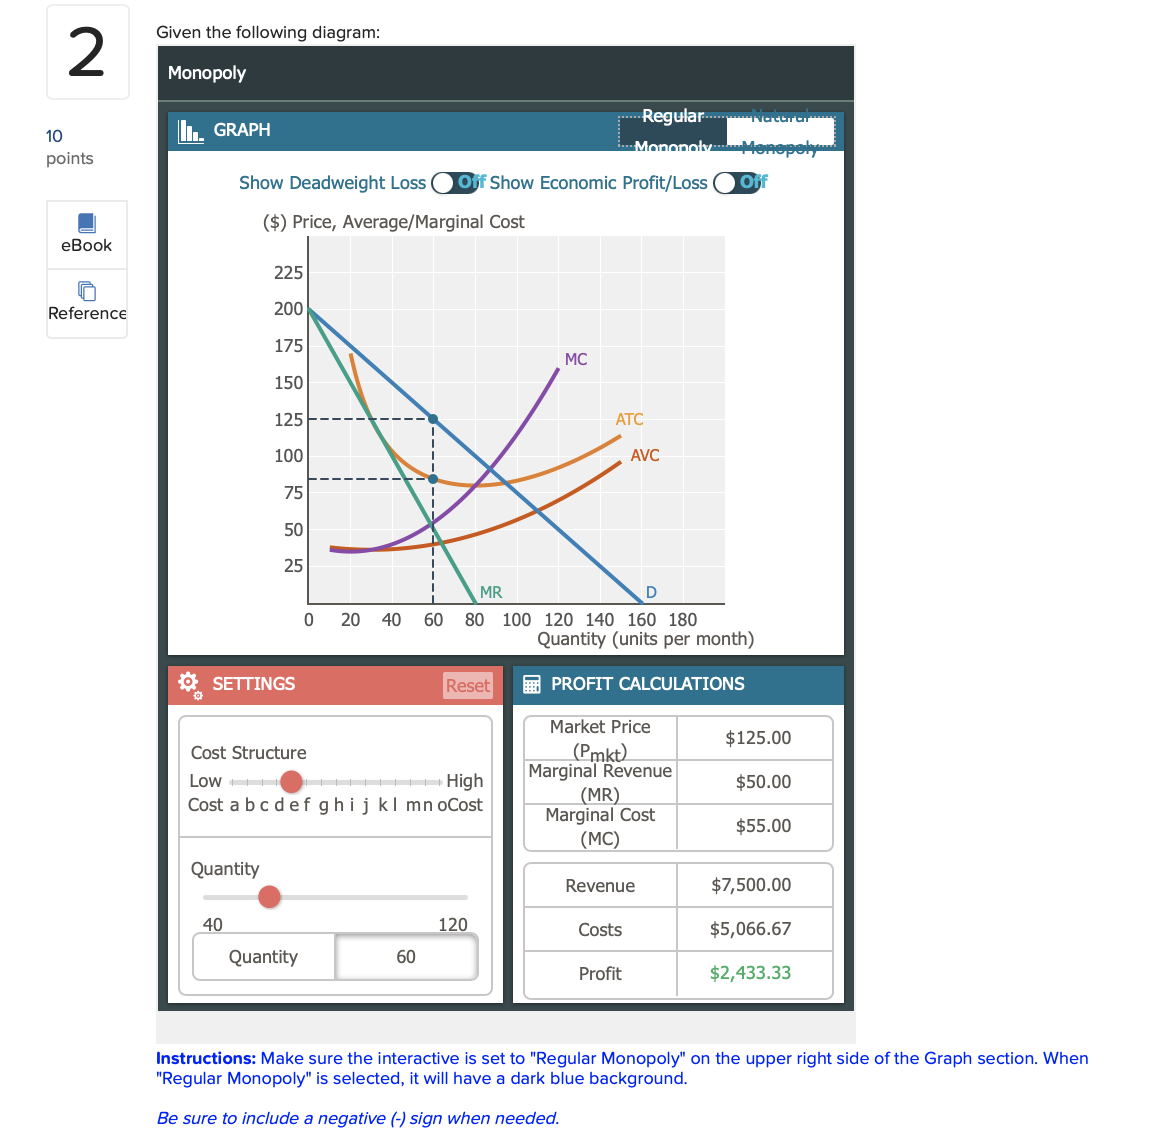
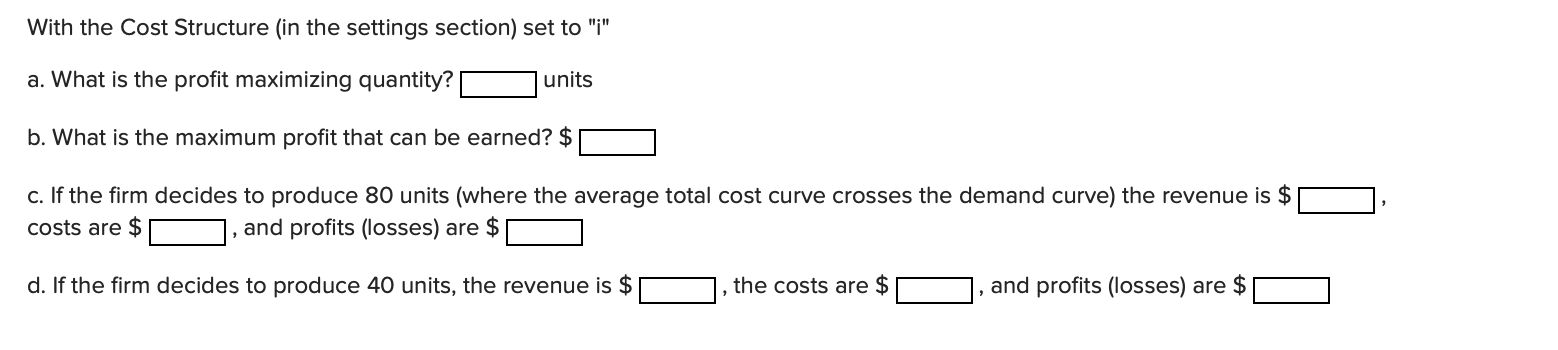
2 Given the following diagram: Monopoly ...Regular 10 . GRAPH points -Monopoly Monopoly Show Deadweight Loss ( Off Show Economic Profit/Loss ( Off ($) Price, Average/Marginal Cost eBook 225 Reference 200 175 150 125 100 75 50 25 MR 0 20 40 60 80 100 120 140 160 180 Quantity (units per month) SETTINGS Reset PROFIT CALCULATIONS Market Price Cost Structure ( Pinkt ) $125.00 Low High Marginal Revenue Cost a bc def ghi j kl mn oCost (MR) $50.00 Marginal Cost (MC) $55.00 Quantity Revenue $7,500.00 40 120 Costs $5,066.67 Quantity 60 Profit $2,433.33 Instructions: Make sure the interactive is set to "Regular Monopoly" on the upper right side of the Graph section. When "Regular Monopoly" is selected, it will have a dark blue background. Be sure to include a negative (-) sign when needed.With the Cost Structure (in the settings section) set to "i" a. What is the prot maximizing quantity? |:| units b. What is the maximum prot that can be earned? $ |:| c. If the rm decides to produce 80 units (where the average total cost curve crosses the demand curve) the revenue is $ |:| , costs are $ |:| , and prots (losses) are 35 |:| d. If the rm decides to produce 40 units, the revenue is $ |:| , the costs are $ |:| , and prots (losses) are 3; |:|
Step by Step Solution
There are 3 Steps involved in it

Get step-by-step solutions from verified subject matter experts