

Question: help will drawing graph is needed as well on these 6 , 7 and 8 6. Plotting the supply of labor In Montgomery, 150 people
help will drawing graph is needed as well on these 6 , 7 and 8
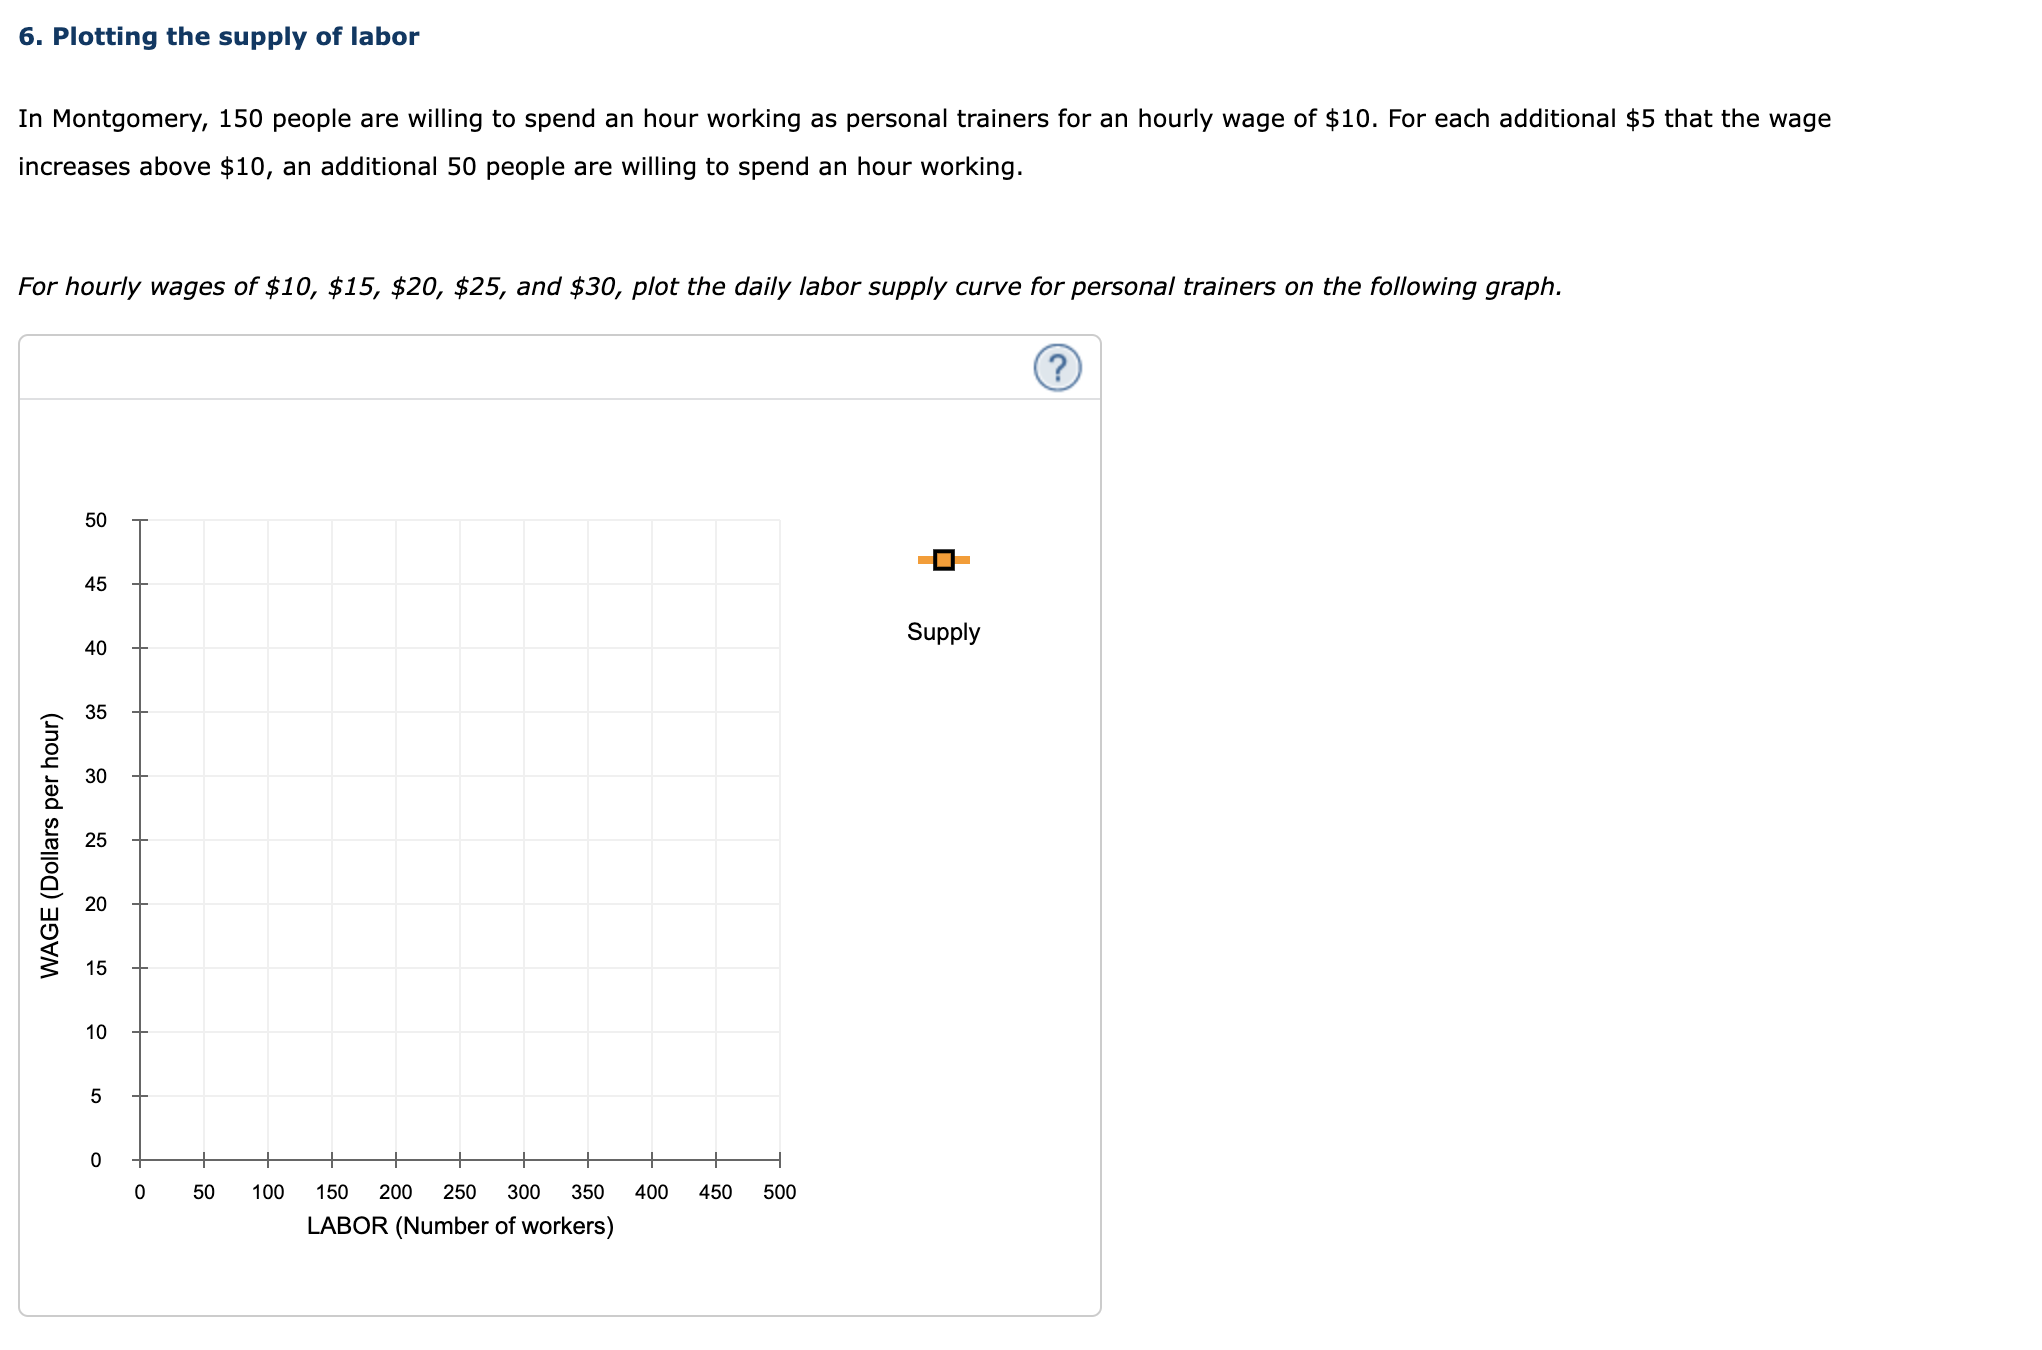

6. Plotting the supply of labor In Montgomery, 150 people are willing to spend an hour working as personal trainers for an hourly wage of $10. For each additional $5 that the wage increases above $10, an additional 50 people are willing to spend an hour working. For hourly wages of $10, $15, $20, $25, and $30, plot the daily labor supply curve for personal trainers on the following graph. WAGE (Dollars per hour) 50 45 40 35 30 25 20 15 10 5 0 0 50 100 150 200 250 300 350 400 450 500 LABOR (Number of workers) Supply ?
Step by Step Solution
There are 3 Steps involved in it
1 Expert Approved Answer
Step: 1 Unlock

Question Has Been Solved by an Expert!
Get step-by-step solutions from verified subject matter experts
Step: 2 Unlock
Step: 3 Unlock