

Question: help with 3 marketing questions LTV Case Study This case involves a company selling seasonal food products (Florida fruit) by catalog, retail store, and face-to-face
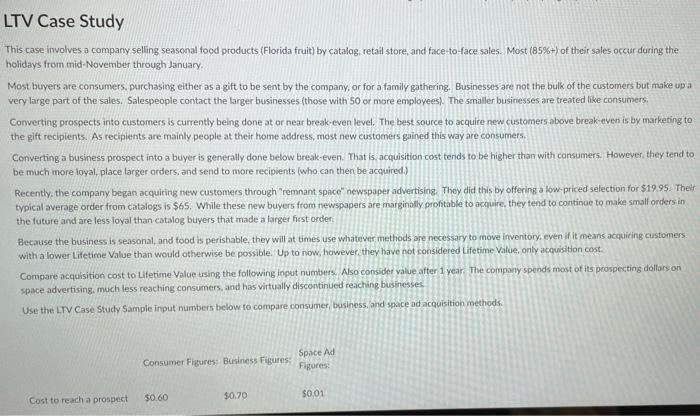
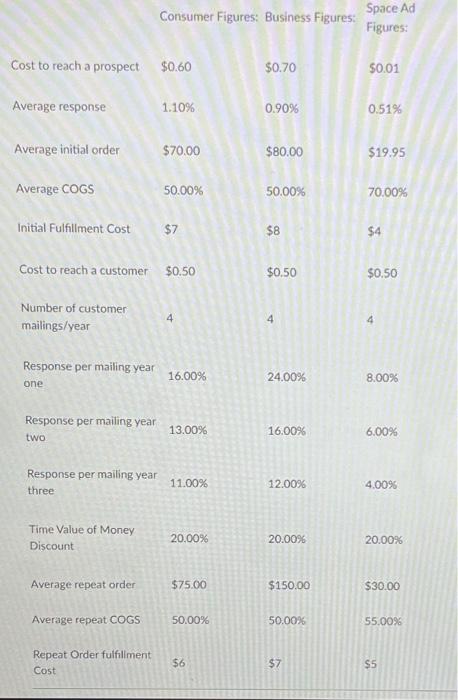
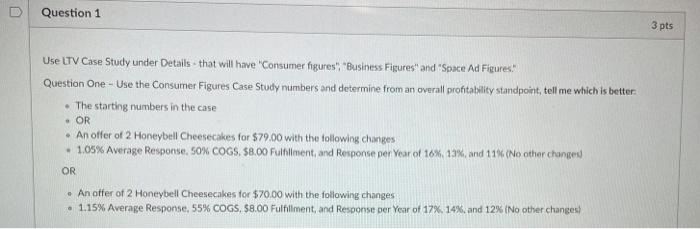
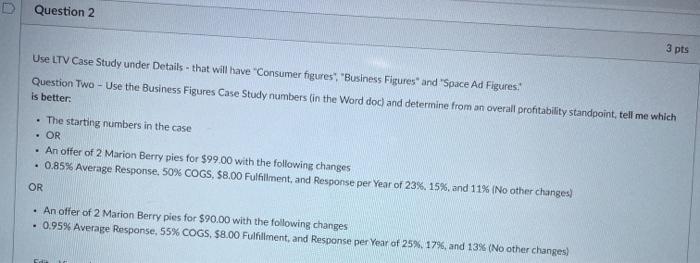
LTV Case Study This case involves a company selling seasonal food products (Florida fruit) by catalog, retail store, and face-to-face sales. Most (85%+) of their sales occur during the holidays from mid-November through January Most buyers are consumers purchasing either as a gift to be sent by the company, or for a family gathering. Businesses are not the bulk of the customers but make up a very large part of the sales. Salespeople contact the larger businesses (those with 50 or more employees). The smaller businesses are treated like consumers. Converting prospects into customers is currently being done at or near break-even level. The best source to acquire new customers above break-even is by marketing to the gift recipients. As recipients are mainly people at their home address, most new customers gained this way are consumers Converting a business prospect into a buyer is generally done below break-even. That is acquisition cost tends to be higher than with consumers. However, they tend to be much more loyal, place larger orders, and send to more recipients (who can then be acquired.) Recently, the company began acquiring new customers through remnant space" newspaper advertising. They did this by offering a low-priced selection for $19.95. Their typical average order from catalogs is $65. While these new buyers from newspapers are marginally prohtable to acquire, they tend to continue to make small orders in the future and are less loyal than catalog buyers that made a larger first order: Because the business is seasonal and food is perishable, they will at times use whatever methods are necessary to move inventory, even if it means acquiring customers. with a lower Lifetime Value than would otherwise be possible. Up to now, however, they have not considered Lifetime Value, only acquisition cost. Compare acquisition cost to Lifetime Value using the following input numbers. Also consider value after 1 year. The company spends most of its prospecting dollars on space advertising, much less reaching consumers, and has virtually discontinued reaching businesses Use the LTV Case Study Sample input numbers below to compare consumer, business, and space ad acquisition methods. Consumer Figures: Business Figures Space Ad Figures Cost to reach a prospect $0.60 $0,70 $0.01 Consumer Figures: Business Figures: Space Ad Figures: Cost to reach a prospect $0.60 $0.70 $0.01 Average response 1.10% 0.90% 0.51% Average initial order $70.00 $80.00 $19.95 Average COGS 50.00% 50.00% 70.00% Initial Fulfillment Cost $7 $8 $4 Cost to reach a customer $0.50 $0.50 $0.50 Number of customer mailings/year Response per mailing year 16.00% 24.00% one 8.00% Response per mailing year 13.00% 16.00% two 6.00% Response per mailing year three 11.00% 12.00% 4.0096 Time Value of Money Discount 20.00% 20.00% 20.00% Average repeat order $75.00 $150.00 $30.00 Average repeat COGS 50.00% 50.00% 55.00% Repeat Order fulfillment Cost $6 $7 S5 Question 1 3 pts Use LTV Case Study under Details - that will have "Consumer figures", "Business Figures" and Space Ad Figures Question One - Use the Consumer Figures Case Study numbers and determine from an overall profitability standpoint, tell me which is better The starting numbers in the case An offer of 2 Honeybell Cheesecakes for $79.00 with the following changes 1.05% Average Response. SOM COGS $8.00 Fulfillment, and Response per Year of 10% 13% and 11% (No other changed OR OR An offer of 2 Honeybell Cheesecakes for $70.00 with the following changes 1.15% Average Response,55% COGS $8.00 Fulfillment, and Response per Year of 17% 14%, and 12% (No other changes Question 2 3 pts Use LTV Case Study under Details that will have "Consumer figures" "Business Figures" and "Space Ad Figures Question TWO - Use the Business Figures Case Study numbers in the Word doc) and determine from an overall profitability standpoint, tell me which is better The starting numbers in the case OR An offer of 2 Marion Berry pies for $99.00 with the following changes . 0.85% Average Response. 50% COGS, $8.00 Fulfillment, and Response per Year of 23%, 15%, and 11% (No other changes) OR . An offer of 2 Marion Berry pies for $90.00 with the following changes 0.95% Average Response, 55% COGS 58.00 Fulfillment, and Response per Year of 25% 17%, and 13% (No other changes) Question 3 4 pts Go on-line and look at the Harry & David web site Select a product or group of products your group thinks would be attractive. Plug in numbers you think make sense in an LTV equation and use LTV to explain why you selected those products. Let me say that again: "Plug in numbers you think enake sense in an LTV equation. Then describe: Average Order (Larger bundles of products or higher priced products get higher average orders, so Product Managers are happy)- what would you do to try to grow average order? Response Rates (More attractive offers get more response rates, so Marketing is happyl - what would you do to try to grow response rates? Fulfillment cost (assume simple orders lowers fulfillment cost, so accounting is happy) - what would you do to try to low the cost to fulfill orders? of anything you can argue against that as a goal if you prefer) For question 3, use your own creative judgement. Based on your exposure to LTV, go to Harry & David, look through the products/offers, and take a guess at numbers you can plug into #3 Question 3 doesn't have right or wrong answers. High priced bundles with high margins, low priced items with higher response rates, you name it. Be creative. I just want to see your thought process LTV Case Study This case involves a company selling seasonal food products (Florida fruit) by catalog, retail store, and face-to-face sales. Most (85%+) of their sales occur during the holidays from mid-November through January Most buyers are consumers purchasing either as a gift to be sent by the company, or for a family gathering. Businesses are not the bulk of the customers but make up a very large part of the sales. Salespeople contact the larger businesses (those with 50 or more employees). The smaller businesses are treated like consumers. Converting prospects into customers is currently being done at or near break-even level. The best source to acquire new customers above break-even is by marketing to the gift recipients. As recipients are mainly people at their home address, most new customers gained this way are consumers Converting a business prospect into a buyer is generally done below break-even. That is acquisition cost tends to be higher than with consumers. However, they tend to be much more loyal, place larger orders, and send to more recipients (who can then be acquired.) Recently, the company began acquiring new customers through remnant space" newspaper advertising. They did this by offering a low-priced selection for $19.95. Their typical average order from catalogs is $65. While these new buyers from newspapers are marginally prohtable to acquire, they tend to continue to make small orders in the future and are less loyal than catalog buyers that made a larger first order: Because the business is seasonal and food is perishable, they will at times use whatever methods are necessary to move inventory, even if it means acquiring customers. with a lower Lifetime Value than would otherwise be possible. Up to now, however, they have not considered Lifetime Value, only acquisition cost. Compare acquisition cost to Lifetime Value using the following input numbers. Also consider value after 1 year. The company spends most of its prospecting dollars on space advertising, much less reaching consumers, and has virtually discontinued reaching businesses Use the LTV Case Study Sample input numbers below to compare consumer, business, and space ad acquisition methods. Consumer Figures: Business Figures Space Ad Figures Cost to reach a prospect $0.60 $0,70 $0.01 Consumer Figures: Business Figures: Space Ad Figures: Cost to reach a prospect $0.60 $0.70 $0.01 Average response 1.10% 0.90% 0.51% Average initial order $70.00 $80.00 $19.95 Average COGS 50.00% 50.00% 70.00% Initial Fulfillment Cost $7 $8 $4 Cost to reach a customer $0.50 $0.50 $0.50 Number of customer mailings/year Response per mailing year 16.00% 24.00% one 8.00% Response per mailing year 13.00% 16.00% two 6.00% Response per mailing year three 11.00% 12.00% 4.0096 Time Value of Money Discount 20.00% 20.00% 20.00% Average repeat order $75.00 $150.00 $30.00 Average repeat COGS 50.00% 50.00% 55.00% Repeat Order fulfillment Cost $6 $7 S5 Question 1 3 pts Use LTV Case Study under Details - that will have "Consumer figures", "Business Figures" and Space Ad Figures Question One - Use the Consumer Figures Case Study numbers and determine from an overall profitability standpoint, tell me which is better The starting numbers in the case An offer of 2 Honeybell Cheesecakes for $79.00 with the following changes 1.05% Average Response. SOM COGS $8.00 Fulfillment, and Response per Year of 10% 13% and 11% (No other changed OR OR An offer of 2 Honeybell Cheesecakes for $70.00 with the following changes 1.15% Average Response,55% COGS $8.00 Fulfillment, and Response per Year of 17% 14%, and 12% (No other changes Question 2 3 pts Use LTV Case Study under Details that will have "Consumer figures" "Business Figures" and "Space Ad Figures Question TWO - Use the Business Figures Case Study numbers in the Word doc) and determine from an overall profitability standpoint, tell me which is better The starting numbers in the case OR An offer of 2 Marion Berry pies for $99.00 with the following changes . 0.85% Average Response. 50% COGS, $8.00 Fulfillment, and Response per Year of 23%, 15%, and 11% (No other changes) OR . An offer of 2 Marion Berry pies for $90.00 with the following changes 0.95% Average Response, 55% COGS 58.00 Fulfillment, and Response per Year of 25% 17%, and 13% (No other changes) Question 3 4 pts Go on-line and look at the Harry & David web site Select a product or group of products your group thinks would be attractive. Plug in numbers you think make sense in an LTV equation and use LTV to explain why you selected those products. Let me say that again: "Plug in numbers you think enake sense in an LTV equation. Then describe: Average Order (Larger bundles of products or higher priced products get higher average orders, so Product Managers are happy)- what would you do to try to grow average order? Response Rates (More attractive offers get more response rates, so Marketing is happyl - what would you do to try to grow response rates? Fulfillment cost (assume simple orders lowers fulfillment cost, so accounting is happy) - what would you do to try to low the cost to fulfill orders? of anything you can argue against that as a goal if you prefer) For question 3, use your own creative judgement. Based on your exposure to LTV, go to Harry & David, look through the products/offers, and take a guess at numbers you can plug into #3 Question 3 doesn't have right or wrong answers. High priced bundles with high margins, low priced items with higher response rates, you name it. Be creative. I just want to see your thought process
Step by Step Solution
There are 3 Steps involved in it

Get step-by-step solutions from verified subject matter experts