

Question: Help with a,b,c Show work The histogram below shows the number of fatalities from collisions involving a motor vehicle in Whatcom County from 2015 to
Help with a,b,c Show work
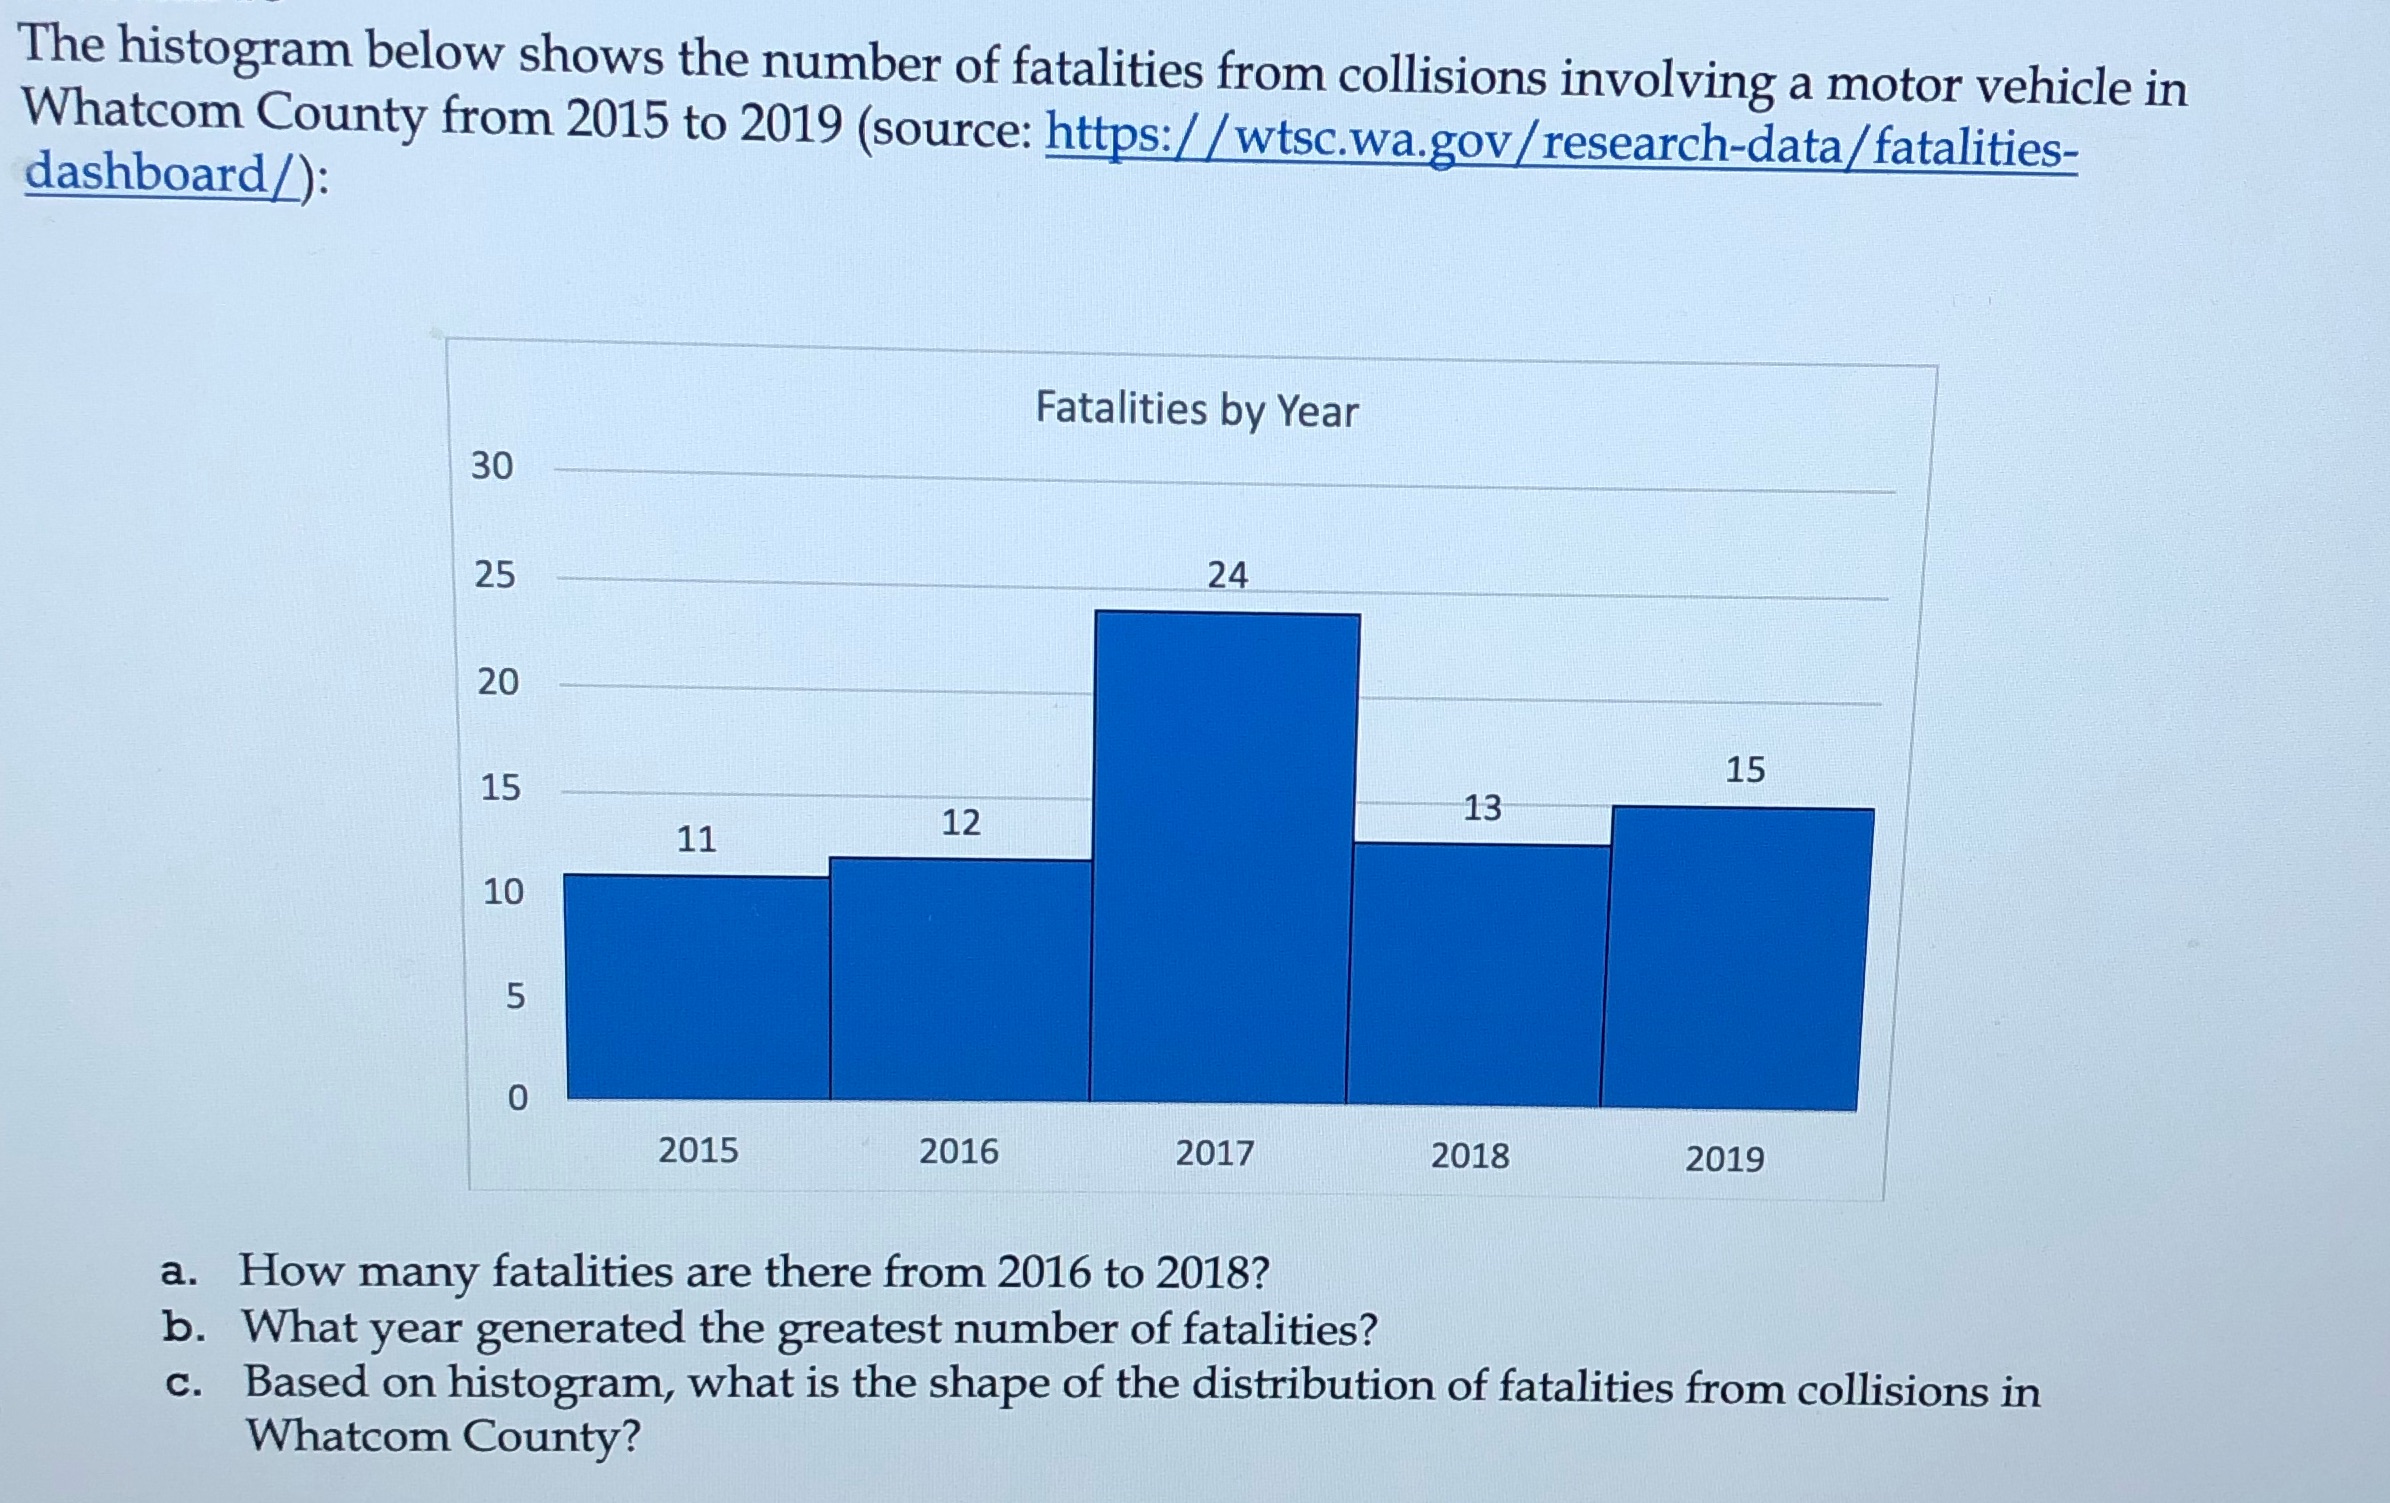
The histogram below shows the number of fatalities from collisions involving a motor vehicle in Whatcom County from 2015 to 2019 (source: https:/ /wtsc.wa.gov/research-data/fatalities- dashboard/): Fatalities by Year 30 25 24 20 15 15 13 11 12 10 5 0 2015 2016 2017 2018 2019 a. How many fatalities are there from 2016 to 2018? b. What year generated the greatest number of fatalities? c. Based on histogram, what is the shape of the distribution of fatalities from collisions in Whatcom County
Step by Step Solution
There are 3 Steps involved in it
1 Expert Approved Answer
Step: 1 Unlock

Question Has Been Solved by an Expert!
Get step-by-step solutions from verified subject matter experts
Step: 2 Unlock
Step: 3 Unlock