

Question: Help with assignment questions:- ffffffConsider a 3-sigma control chart with a center line at po and based on n = 5. Assuming normality, calculate the
Help with assignment questions:-
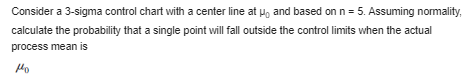
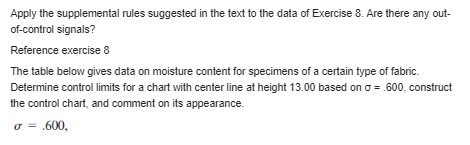

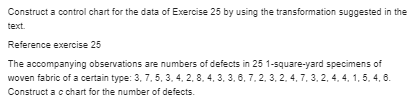
\f\f\f\f\f\fConsider a 3-sigma control chart with a center line at po and based on n = 5. Assuming normality, calculate the probability that a single point will fall outside the control limits when the actual process mean isApply the supplemental rules suggested in the text to the data of Exercise 8. Are there any out- of-control signals? Reference exercise 8 The table below gives data on moisture content for specimens of a certain type of fabric. Determine control limits for a chart with center line at height 13.00 based on o = .600, construct the control chart, and comment on its appearance. OF = .600.\f\f\f\f\f
Step by Step Solution
There are 3 Steps involved in it

Get step-by-step solutions from verified subject matter experts