

Question: Help with B Exercise 12-27 Algo Eighty eight cities provided Information on vacancy rates (in percent) In local apartments In the following frequency distribution. The
Help with B
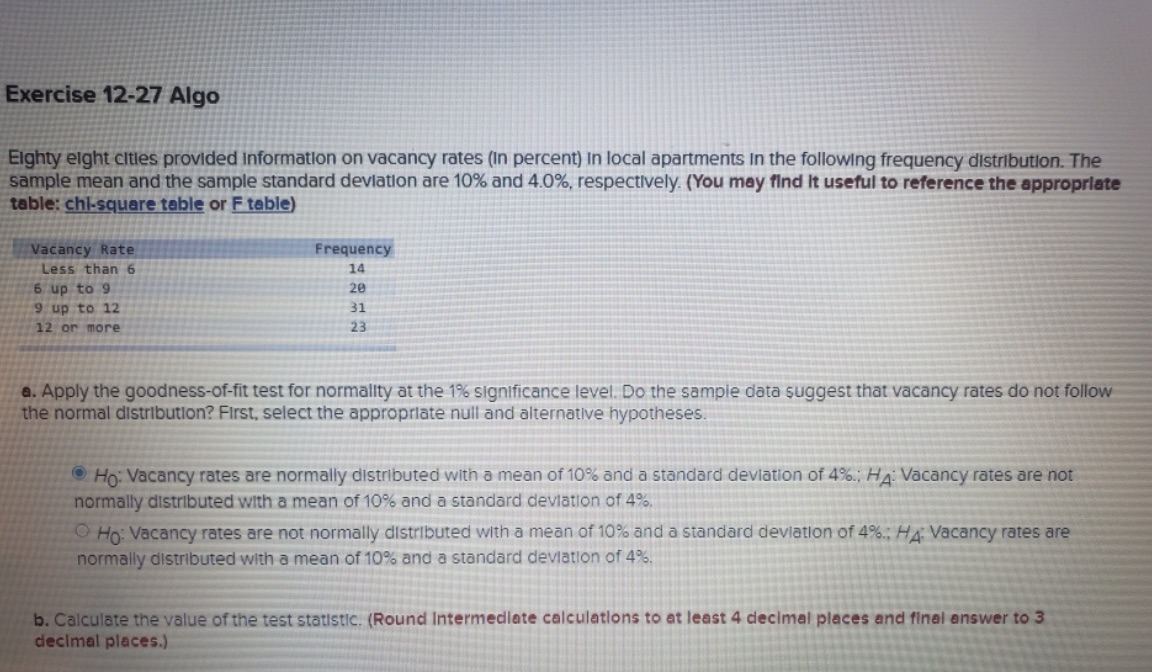
Exercise 12-27 Algo Eighty eight cities provided Information on vacancy rates (in percent) In local apartments In the following frequency distribution. The sample mean and the sample standard deviation are 10% and 4.0%, respectively. (You may find it useful to reference the appropriate table: chl-square table or F table) Vacancy Rate Frequency Less than 6 14 6 up to 9 20 9 up to 12 31 12 or more 23 a. Apply the goodness-of-fit test for normality at the 1% significance level. Do the sample data suggest that vacancy rates do not follow the normal distribution? First, select the appropriate null and alternative hypotheses. Ho: Vacancy rates are normally distributed with a mean of 10% and a standard deviation of 4%.; HA: Vacancy rates are not normally distributed with a mean of 10% and a standard deviation of 4% O Ho: Vacancy rates are not normally distributed with a mean of 10% and a standard deviation of 4%.; HA Vacancy rates are normally distributed with a mean of 10% and a standard deviation of 4%. b. Calculate the value of the test statistic. (Round Intermediate calculations to at least 4 decimal places and final answer to 3 decimal places.)
Step by Step Solution
There are 3 Steps involved in it

Get step-by-step solutions from verified subject matter experts