

Question: help with CAAR question The chart below shows the cumulative abnormal returns (CAAR) of two different stocks, A and B, traded in the same market,
help with CAAR question
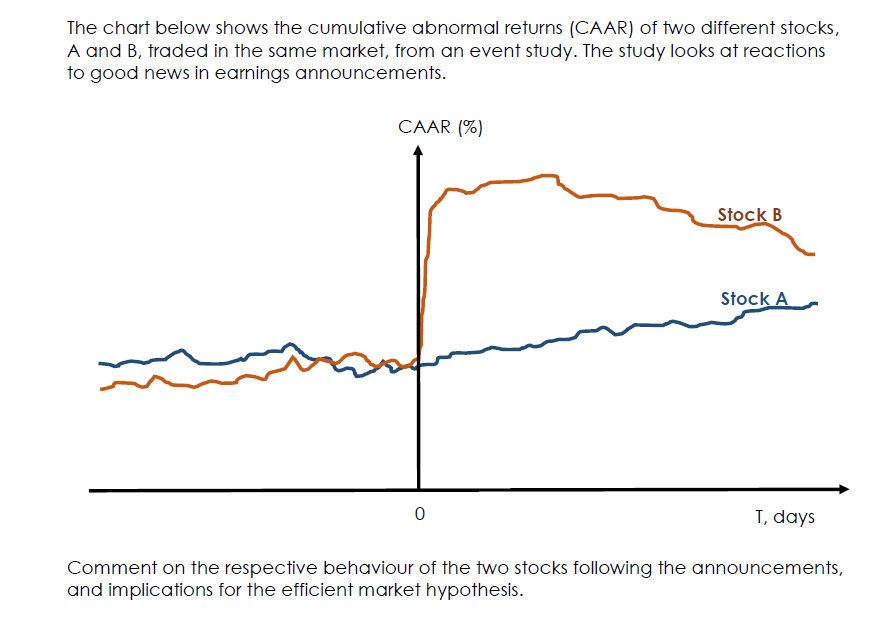
The chart below shows the cumulative abnormal returns (CAAR) of two different stocks, A and B, traded in the same market, from an event study. The study looks at reactions to good news in earnings announcements. CAAR (%) Stock B Stock A 0 T, days Comment on the respective behaviour of the two stocks following the announcements, and implications for the efficient market hypothesis
Step by Step Solution
There are 3 Steps involved in it
1 Expert Approved Answer
Step: 1 Unlock

Question Has Been Solved by an Expert!
Get step-by-step solutions from verified subject matter experts
Step: 2 Unlock
Step: 3 Unlock