

Question: Help ! With explanation if possible. This course is really hurting my brain. Consider the following table summarizing the speed limit of a certain road
Help ! With explanation if possible. This course is really hurting my brain.
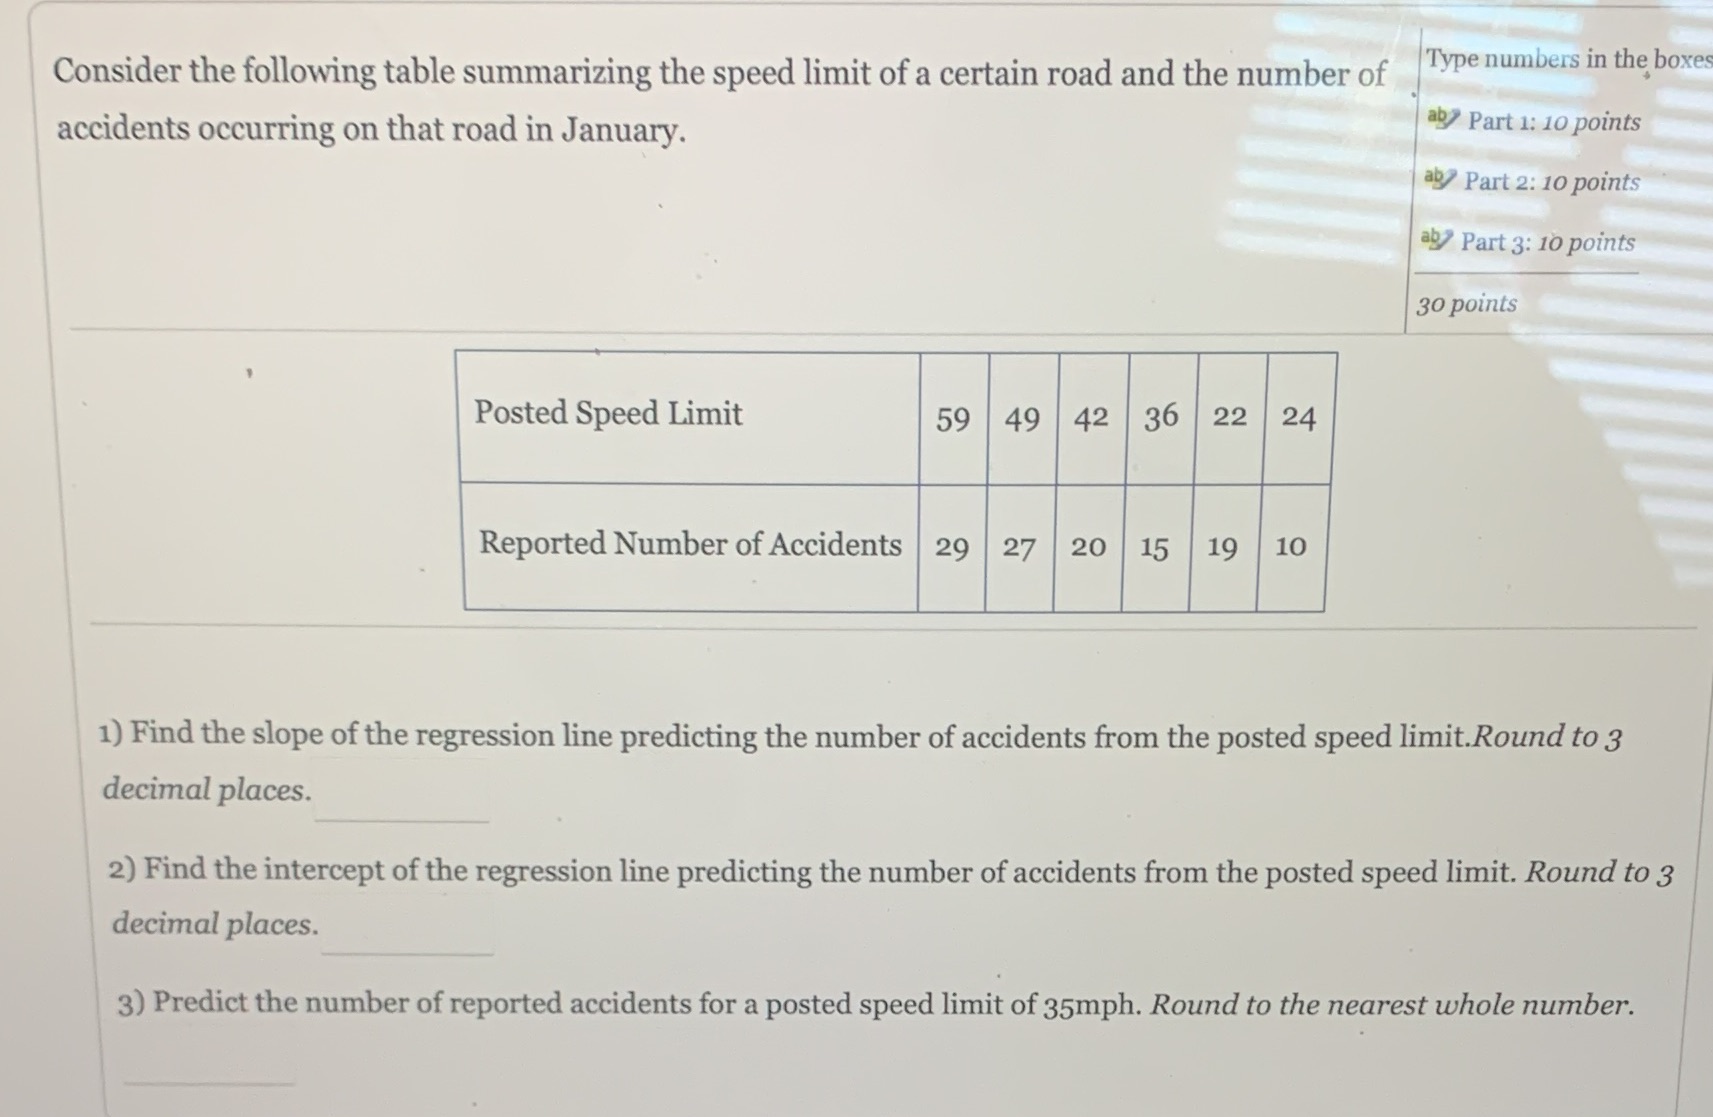
Consider the following table summarizing the speed limit of a certain road and the number of Type numbers in the boxes accidents occurring on that road in January. ab Part 1: 10 points ab Part 2: 10 points ab/ Part 3: 10 points 30 points Posted Speed Limit 59 49 42 36 22 24 Reported Number of Accidents 29 27 20 15 19 10 1) Find the slope of the regression line predicting the number of accidents from the posted speed limit. Round to 3 decimal places. 2) Find the intercept of the regression line predicting the number of accidents from the posted speed limit. Round to 3 decimal places. 3) Predict the number of reported accidents for a posted speed limit of 35mph. Round to the nearest whole number
Step by Step Solution
There are 3 Steps involved in it

Get step-by-step solutions from verified subject matter experts