Question: help with gantt chart please 21 (1Protected ViewSaved to this PC 0 100 75 100 125 0 0 | O 0 0 Mailings Review View
help with gantt chart please
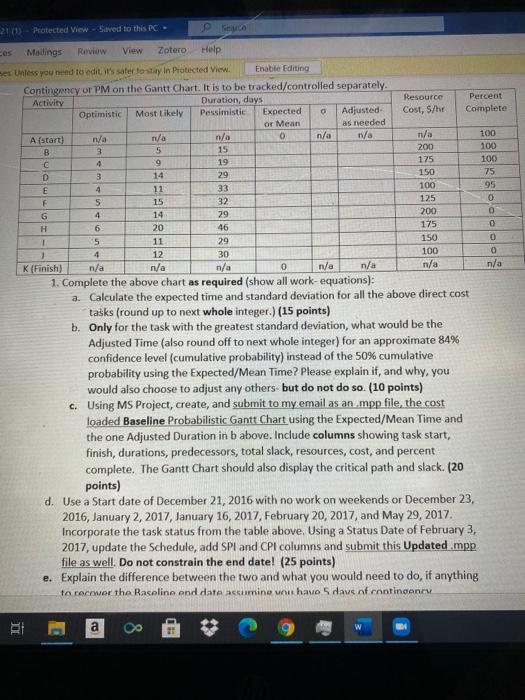
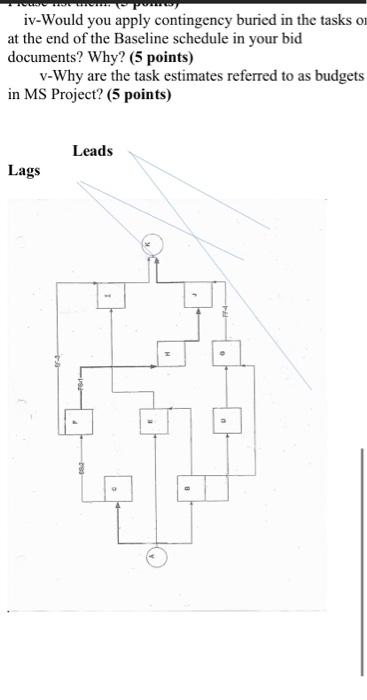
21 (1Protected ViewSaved to this PC 0 100 75 100 125 0 0 | O 0 0 Mailings Review View Zotero Help es Unless you need to edit it's safe to stay in Protected View Enable Editing Contingency or PM on the Gantt Chart. It is to be tracked/controlled separately. Activity Duration, days Resource Percent Optimistic Most likely Pessimistic Expected Adjusted Cost, S/hr Complete or Mean as needed A (start) n/a n/a n/a 0 n/a n/a n/a B 3 5 15 200 100 C 9 19 175 100 D 3 14 29 150 E 11 33 95 F 15 32 G 4 14 79 200 H 6 20 46 175 1 5 11 29 150 1 4 12 30 100 0 K(Finish) n/a n/a n/a 0 n/a n/a n/a n/a 1. Complete the above chart as required (show all work-equations): a. Calculate the expected time and standard deviation for all the above direct cost tasks (round up to next whole integer.) (15 points) b. Only for the task with the greatest standard deviation, what would be the Adjusted Time (also round off to next whole integer) for an approximate 84% confidence level (cumulative probability) instead of the 50% cumulative probability using the Expected/Mean Time? Please explain it, and why, you would also choose to adjust any others but do not do so. (10 points) c. Using MS Project, create, and submit to my email as an mpp file, the cost loaded Baseline Probabilistic Gantt Chart using the Expected/Mean Time and the one Adjusted Duration in b above. Include columns showing task start, finish, durations, predecessors, total slack, resources, cost, and percent complete. The Gantt Chart should also display the critical path and slack. (20 points) d. Use a Start date of December 21, 2016 with no work on weekends or December 23, 2016, January 2, 2017 January 16, 2017 February 20, 2017, and May 29, 2017. Incorporate the task status from the table above. Using a Status Date of February 3, 2017, update the Schedule, add SPI and CPI columns and submit this Updated map file as well. Do not constrain the end date! (25 points) e. Explain the difference between the two and what you would need to do, if anything to recover the Raceline and date acumine van have 5 dave of contingency a iv-Would you apply contingency buried in the tasks on at the end of the Baseline schedule in your bid documents? Why? (5 points) v-Why are the task estimates referred to as budgets in MS Project? (5 points) Leads Lags 2 N 19 21 (1Protected ViewSaved to this PC 0 100 75 100 125 0 0 | O 0 0 Mailings Review View Zotero Help es Unless you need to edit it's safe to stay in Protected View Enable Editing Contingency or PM on the Gantt Chart. It is to be tracked/controlled separately. Activity Duration, days Resource Percent Optimistic Most likely Pessimistic Expected Adjusted Cost, S/hr Complete or Mean as needed A (start) n/a n/a n/a 0 n/a n/a n/a B 3 5 15 200 100 C 9 19 175 100 D 3 14 29 150 E 11 33 95 F 15 32 G 4 14 79 200 H 6 20 46 175 1 5 11 29 150 1 4 12 30 100 0 K(Finish) n/a n/a n/a 0 n/a n/a n/a n/a 1. Complete the above chart as required (show all work-equations): a. Calculate the expected time and standard deviation for all the above direct cost tasks (round up to next whole integer.) (15 points) b. Only for the task with the greatest standard deviation, what would be the Adjusted Time (also round off to next whole integer) for an approximate 84% confidence level (cumulative probability) instead of the 50% cumulative probability using the Expected/Mean Time? Please explain it, and why, you would also choose to adjust any others but do not do so. (10 points) c. Using MS Project, create, and submit to my email as an mpp file, the cost loaded Baseline Probabilistic Gantt Chart using the Expected/Mean Time and the one Adjusted Duration in b above. Include columns showing task start, finish, durations, predecessors, total slack, resources, cost, and percent complete. The Gantt Chart should also display the critical path and slack. (20 points) d. Use a Start date of December 21, 2016 with no work on weekends or December 23, 2016, January 2, 2017 January 16, 2017 February 20, 2017, and May 29, 2017. Incorporate the task status from the table above. Using a Status Date of February 3, 2017, update the Schedule, add SPI and CPI columns and submit this Updated map file as well. Do not constrain the end date! (25 points) e. Explain the difference between the two and what you would need to do, if anything to recover the Raceline and date acumine van have 5 dave of contingency a iv-Would you apply contingency buried in the tasks on at the end of the Baseline schedule in your bid documents? Why? (5 points) v-Why are the task estimates referred to as budgets in MS Project? (5 points) Leads Lags 2 N 19