

Question: Help with MatLab HW problem using for loops Problem 1 (20 pts) For loops are one of the more complex topics covers in this course,
Help with MatLab HW problem using for loops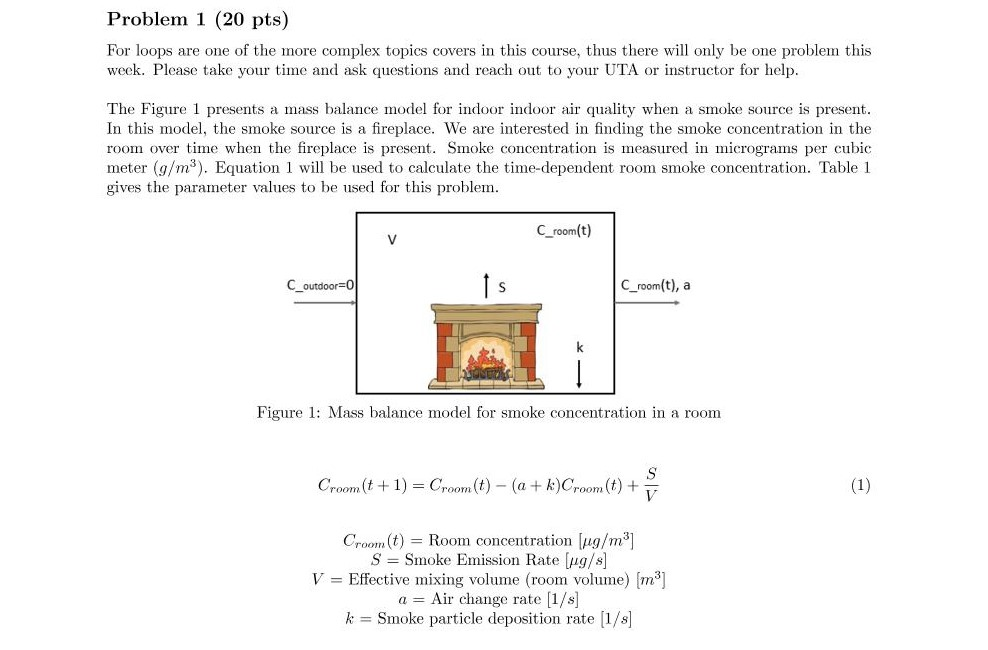
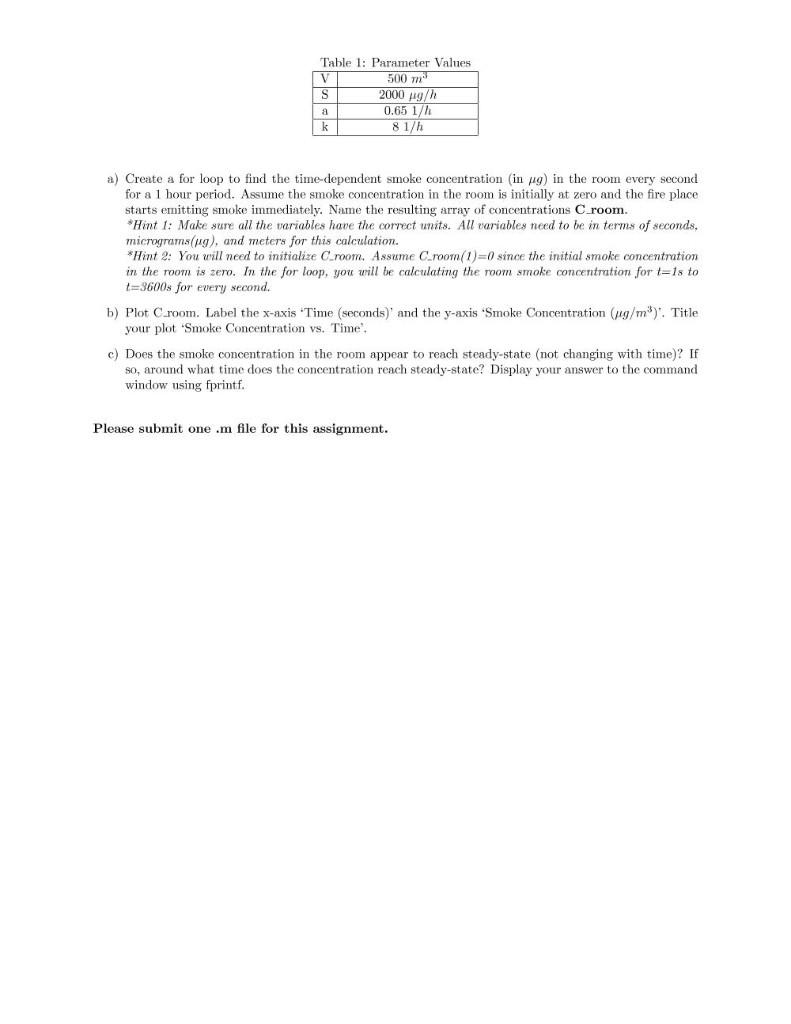
Problem 1 (20 pts) For loops are one of the more complex topics covers in this course, thus there will only be one problem this weck. Please take your time and ask questions and reach out to your UTA or instructor for help The Figure 1 presents a mass balance model for indoor indoor air quality when a smoke source is present In this model, the smoke source is a fireplace. We are interested in finding the smoke concentration in the room over time when the fireplace is present. Smoke concentration is measured in micrograms per cubic meter (g/m3). Equation 1 will be used to calculate the time-dependent room smoke concentration. Table 1 gives the parameter values to be used for this problem room C room(t), a Figure 1: Mass balance model for smoke concentration in a room Croom (t1) Croom(t) akCroom( Croom (t) Room concentration 11g/m3] S Smoke Emission Rate g/s] V Effective mixing volume (room volume) m3] aAir change rate 1/s) k Smoke particle deposition rate 1/s Table 1: Parameter Values 500 2000 Ag 0.65 1/h 8 1/h a) Create a for loop to find the tine-dependent smoke concentration (in 9) in the room every second for a 1 hour period. Assume the smoke concentration in the room is initially at zero and the fire place starts emitting smoke immediately. Name the resulting array of concentrations C room. Hint : Make sure all the variables have the correctut. All variables need to be in terms of seconds, micrograms(g), and meters for this calculation. *Hint 2: You will need to initialize C.room. Assume C.room(1)- since the initial smoke concentration in the room is zero. In the for loop, you will be calculating the room smoke concentration for t-1s to t=3600s for every second. b) Plot Croom. Label the x-axis Time (seconds)' and the y-axis Smoke Concentration (ug/m3. Title your plot 'Smoke Concentration vs. Time'. c) Does the smoke concentration in the room appear to reach steady-state (not changing with time)? If so, around what time does the concentration reach steady-state? Display your answer to the command window using fprintf. Please submit one .m file for this assignment
Step by Step Solution
There are 3 Steps involved in it

Get step-by-step solutions from verified subject matter experts