

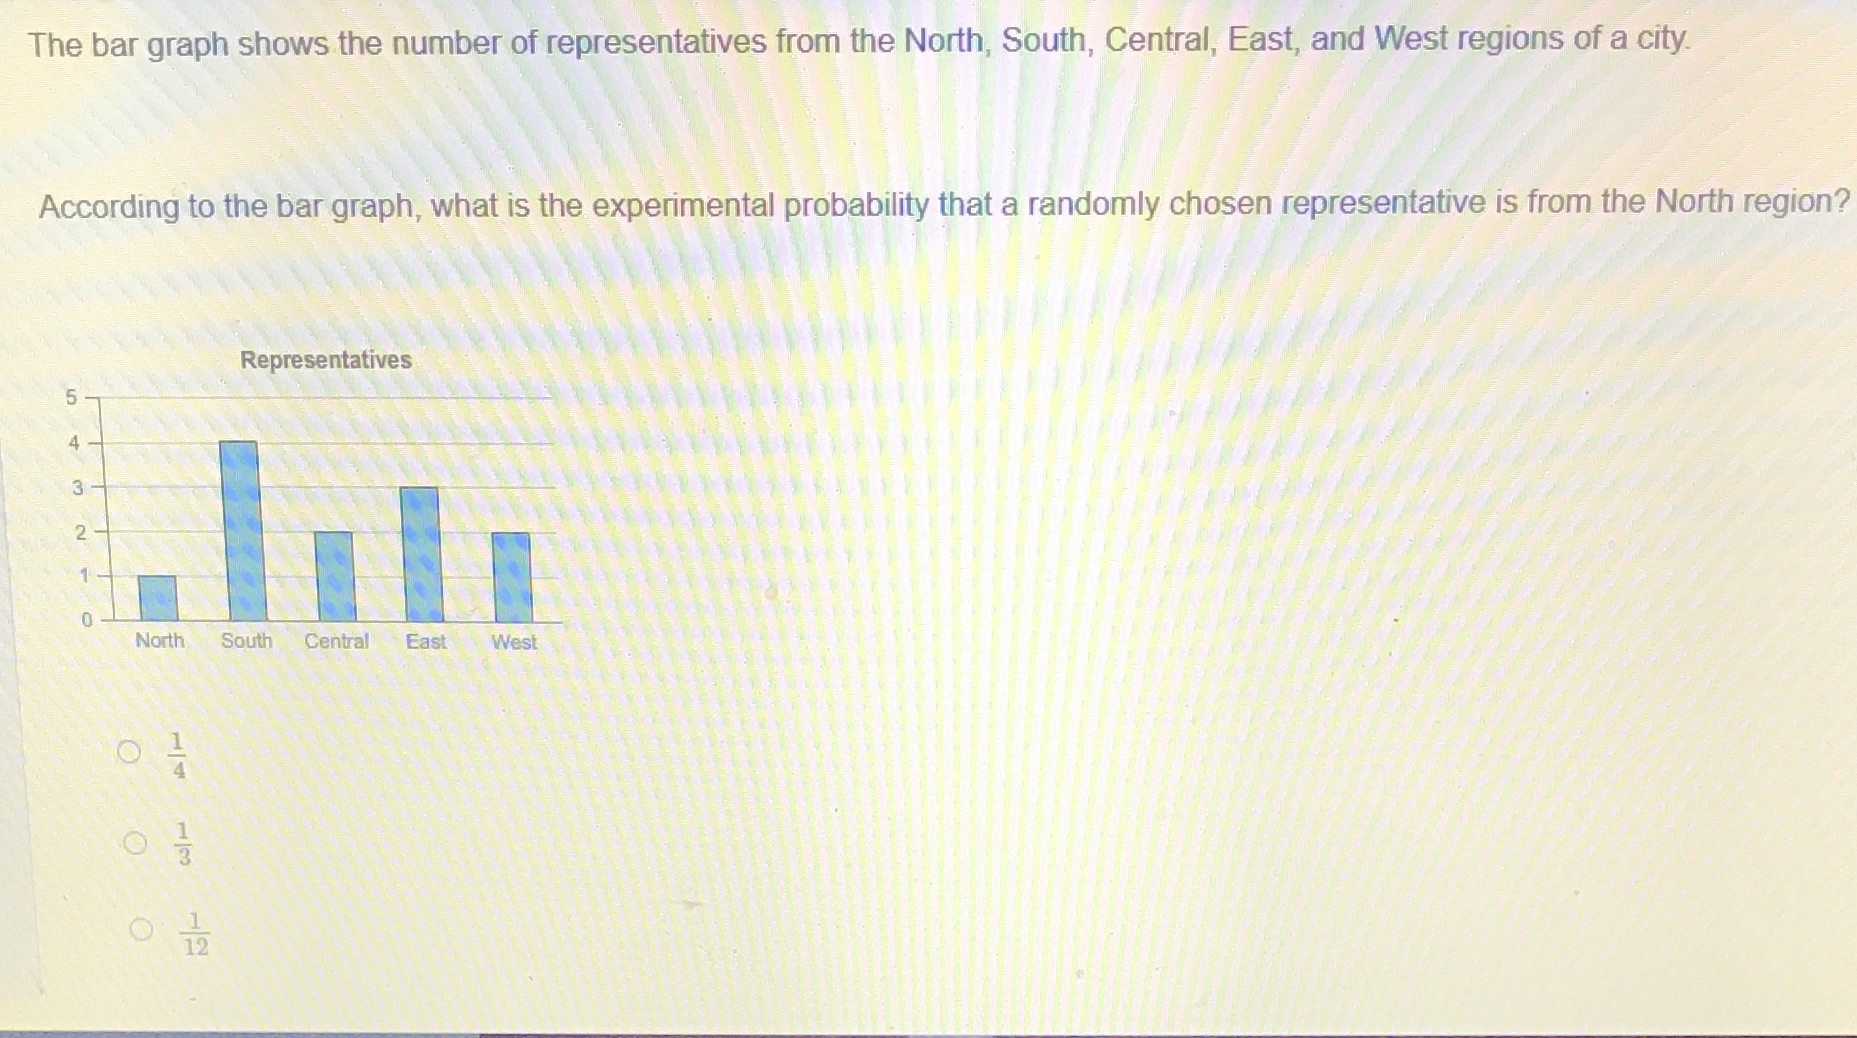
Question: Help with practical math !!! The bar graph shows the number of representatives from the North, South, Central, East, and West regions of a city.
Help with practical math !!!
Step by Step Solution
There are 3 Steps involved in it
1 Expert Approved Answer
Step: 1 Unlock

Question Has Been Solved by an Expert!
Get step-by-step solutions from verified subject matter experts
Step: 2 Unlock
Step: 3 Unlock