

Question: Help with problem 3. This is on the program R Second Assignment te *PROVIDE ALL CODE AND ANSWERS/PLOTS* 1. Load the Guyer dataset for the
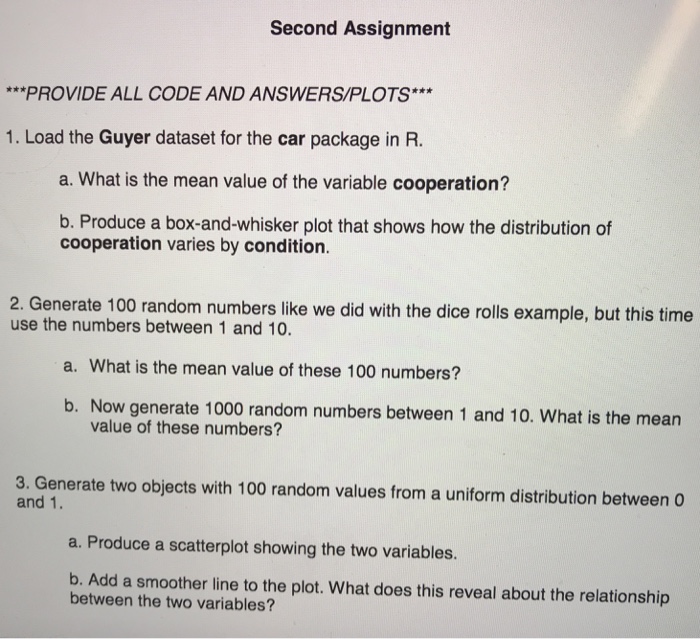
Second Assignment te *PROVIDE ALL CODE AND ANSWERS/PLOTS* 1. Load the Guyer dataset for the car package in R. a. What is the mean value of the variable cooperation? b. Produce a box-and-whisker plot that shows how the distribution of cooperation varies by condition. 2. Generate 100 random numbers like we did with the dice rolls example, but this time use the numbers between 1 and 10 a. What is the mean value of these 100 numbers? b. Now generate 1000 random numbers between 1 and 10. What is the mean value of these numbers? 3. Generate two objects with 100 random values from a uniform distribution between 0 and 1. a. Produce a scatterplot showing the two variables. b. Add a smoother line to the plot. What does this reveal about the relationship between the two variables
Step by Step Solution
There are 3 Steps involved in it

Get step-by-step solutions from verified subject matter experts