

Question: Help with Steps on how to do this or something similar in excel? *also pictured is closing prices that will be used for calculating question
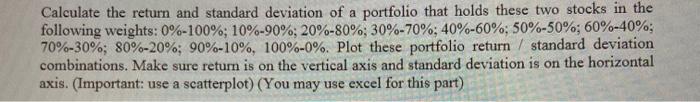
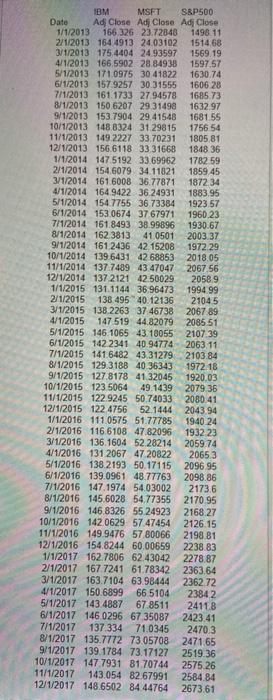
Calculate the return and standard deviation of a portfolio that holds these two stocks in the following weights: 0%-100%; 10%-90%; 20%-80% 30%-70%; 40%-60%; 50%-50%; 60%-40%; 70%-30%; 80%-20%; 90%-10%, 100%-0%. Plot these portfolio return / standard deviation combinations. Make sure return is on the vertical axis and standard deviation is on the horizontal axis. (Important: use a scatterplot) (You may use excel for this part) IBM MSFT SRP500 Date Ad Close Ad Close Adj Close 1/1/2013 166 326 23.72848 1498 11 2/1/2013 164 4913 24.03192 1514.68 3/1/2013 175.4404 24.93597 1569.19 4/1/2013 166,5902 28 84938 1597,57 5/1/2013 171,0975 30 41822 1630.74 6/1/2013 157.9257 30.31555 1606 28 7/1/2013 161.1733 27 94578 1685.73 8/1/2013 150.6207 29 31498 1632 97 9/1/2013 153.7904 29.41548 1681.55 10/1/2013 148.8324 31 29815 1756 54 11/1/2013 149 2227 33.70231 1805 81 12/1/2013 156,6118 33 31668 1848 36 1/1/2014 147 5192 33.69962 1782 59 2/1/2014 154.6079 34.11821 1859 45 3/1/2014 161 6008 36.77871 1872 34 4/1/2014 164 9422 36.24931 1883.95 5/1/2014 154.7755 36.73384 1923 57 6/1/2014 153 0674 37 67971 1960.23 7/1/2014 161.8493 38.99896 1930.67 8/1/2014 162.3813 410501 2003.37 9/1/2014 161 2436 42 15208 1972.29 10/1/2014 139 6431 42 68863 2018.05 11/1/2014 137 7489 43 47047 2067 56 12/1/2014 137 2121 4250029 2058.9 1/1/2015 131.1144 36.96473 1994 99 2/1/2015 138 495 40.12136 21045 3/1/2015 138 2263 3746738 2067 89 4/1/2015 147 519 4482079 2085 51 5/1/2015 146 1065 43. 18055 2107 39 6/1/2015 142 2341 40.94774 2063 11 7/1/2015 1416482 43.31279 2103.84 8/1/2015 129.3188 40.36343 1972 18 9/1/2015 127.8178 41.32045 1920.03 10/1/2015 123 5064 49.1439 2079.36 11/1/2015 122.9245 5074033 2080 41 12/1/2015 122 4756 52.1444 2043 94 1/1/2016 1110575 51.77785 1940 24 2/1/2016 116 6108 47.82096 1932 23 3/1/2016 136.1604 52.28214 2059 74 4/1/2016 131 2067 47.20822 2065.3 5/1/2016 138 2193 50.17115 2096 95 6/1/2016 139.0961 48.77763 2098.86 7/1/2016 147.1974 54.03002 2173,6 8/1/2016 145.6028 54.77355 2170.95 9/1/2016 146.8326 55 24923 2168.27 10/1/2016 142.0629 57 47454 2126.15 11/1/2016 149.9476 57 80066 2198 81 12/1/2016 154.8244 60.00559 2238 83 1/1/2017 162.7806 62.43042 2278.87 2/1/2017 167 7241 61.78342 2363.64 3/1/2017 163.7104 63.98444 236272 4/1/2017 150 6899 66.5104 23842 5/1/2017 143.4887 67.8511 2411.8 6/1/2017 146 0296 6735087 2423 41 7/1/2017 137.334 71.0345 2470.3 8/1/2017 135.7772 73.05708 247165 9/1/2017 139.1784 73.17127 2519.36 10/1/2017 147.7931 81 70744 2575.26 11/1/2017 143.054 82.67991 2584.84 12/1/2017 148.6502 84 44764 2673.61 Calculate the return and standard deviation of a portfolio that holds these two stocks in the following weights: 0%-100%; 10%-90%; 20%-80% 30%-70%; 40%-60%; 50%-50%; 60%-40%; 70%-30%; 80%-20%; 90%-10%, 100%-0%. Plot these portfolio return / standard deviation combinations. Make sure return is on the vertical axis and standard deviation is on the horizontal axis. (Important: use a scatterplot) (You may use excel for this part) IBM MSFT SRP500 Date Ad Close Ad Close Adj Close 1/1/2013 166 326 23.72848 1498 11 2/1/2013 164 4913 24.03192 1514.68 3/1/2013 175.4404 24.93597 1569.19 4/1/2013 166,5902 28 84938 1597,57 5/1/2013 171,0975 30 41822 1630.74 6/1/2013 157.9257 30.31555 1606 28 7/1/2013 161.1733 27 94578 1685.73 8/1/2013 150.6207 29 31498 1632 97 9/1/2013 153.7904 29.41548 1681.55 10/1/2013 148.8324 31 29815 1756 54 11/1/2013 149 2227 33.70231 1805 81 12/1/2013 156,6118 33 31668 1848 36 1/1/2014 147 5192 33.69962 1782 59 2/1/2014 154.6079 34.11821 1859 45 3/1/2014 161 6008 36.77871 1872 34 4/1/2014 164 9422 36.24931 1883.95 5/1/2014 154.7755 36.73384 1923 57 6/1/2014 153 0674 37 67971 1960.23 7/1/2014 161.8493 38.99896 1930.67 8/1/2014 162.3813 410501 2003.37 9/1/2014 161 2436 42 15208 1972.29 10/1/2014 139 6431 42 68863 2018.05 11/1/2014 137 7489 43 47047 2067 56 12/1/2014 137 2121 4250029 2058.9 1/1/2015 131.1144 36.96473 1994 99 2/1/2015 138 495 40.12136 21045 3/1/2015 138 2263 3746738 2067 89 4/1/2015 147 519 4482079 2085 51 5/1/2015 146 1065 43. 18055 2107 39 6/1/2015 142 2341 40.94774 2063 11 7/1/2015 1416482 43.31279 2103.84 8/1/2015 129.3188 40.36343 1972 18 9/1/2015 127.8178 41.32045 1920.03 10/1/2015 123 5064 49.1439 2079.36 11/1/2015 122.9245 5074033 2080 41 12/1/2015 122 4756 52.1444 2043 94 1/1/2016 1110575 51.77785 1940 24 2/1/2016 116 6108 47.82096 1932 23 3/1/2016 136.1604 52.28214 2059 74 4/1/2016 131 2067 47.20822 2065.3 5/1/2016 138 2193 50.17115 2096 95 6/1/2016 139.0961 48.77763 2098.86 7/1/2016 147.1974 54.03002 2173,6 8/1/2016 145.6028 54.77355 2170.95 9/1/2016 146.8326 55 24923 2168.27 10/1/2016 142.0629 57 47454 2126.15 11/1/2016 149.9476 57 80066 2198 81 12/1/2016 154.8244 60.00559 2238 83 1/1/2017 162.7806 62.43042 2278.87 2/1/2017 167 7241 61.78342 2363.64 3/1/2017 163.7104 63.98444 236272 4/1/2017 150 6899 66.5104 23842 5/1/2017 143.4887 67.8511 2411.8 6/1/2017 146 0296 6735087 2423 41 7/1/2017 137.334 71.0345 2470.3 8/1/2017 135.7772 73.05708 247165 9/1/2017 139.1784 73.17127 2519.36 10/1/2017 147.7931 81 70744 2575.26 11/1/2017 143.054 82.67991 2584.84 12/1/2017 148.6502 84 44764 2673.61
Step by Step Solution
There are 3 Steps involved in it

Get step-by-step solutions from verified subject matter experts