

Question: Help with the following questions. Do not need to help with the parts with drop down menus. Win/Loss and With/Without Joe: Joe plays basketball for
Help with the following questions.
Do not need to help with the parts with drop down menus.
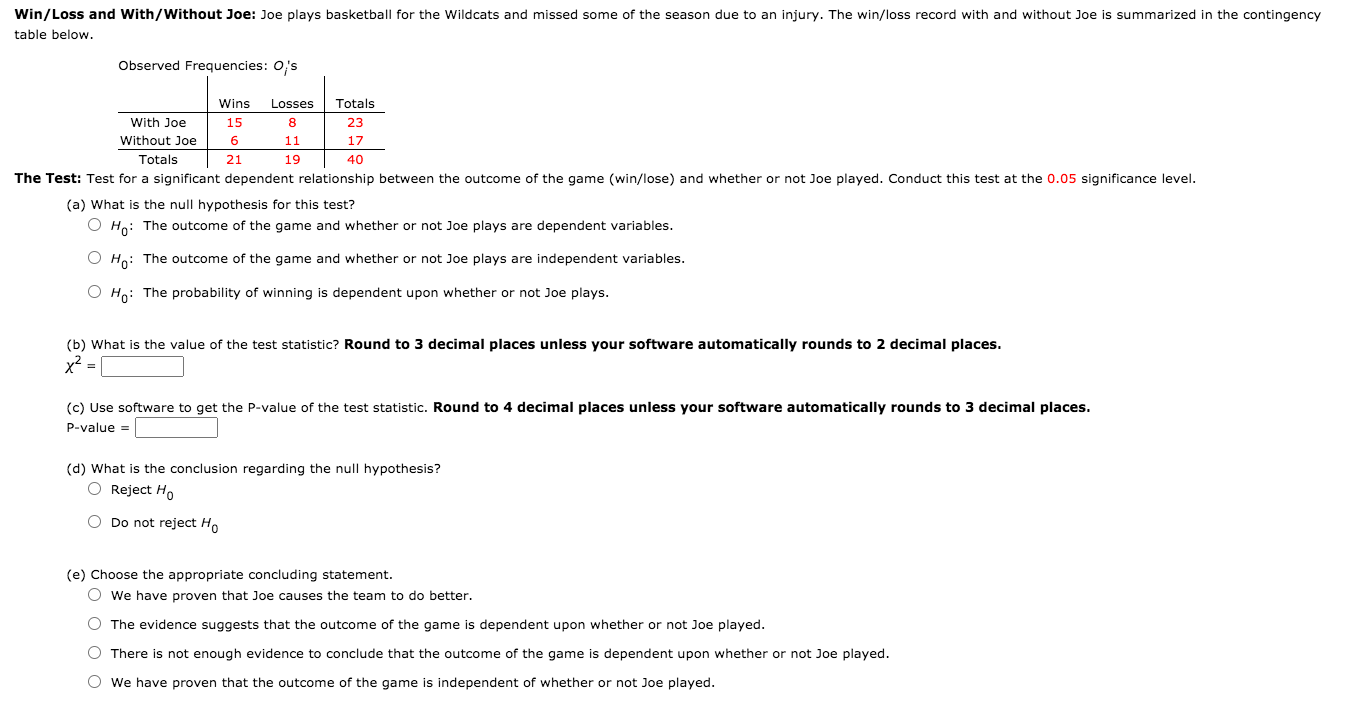
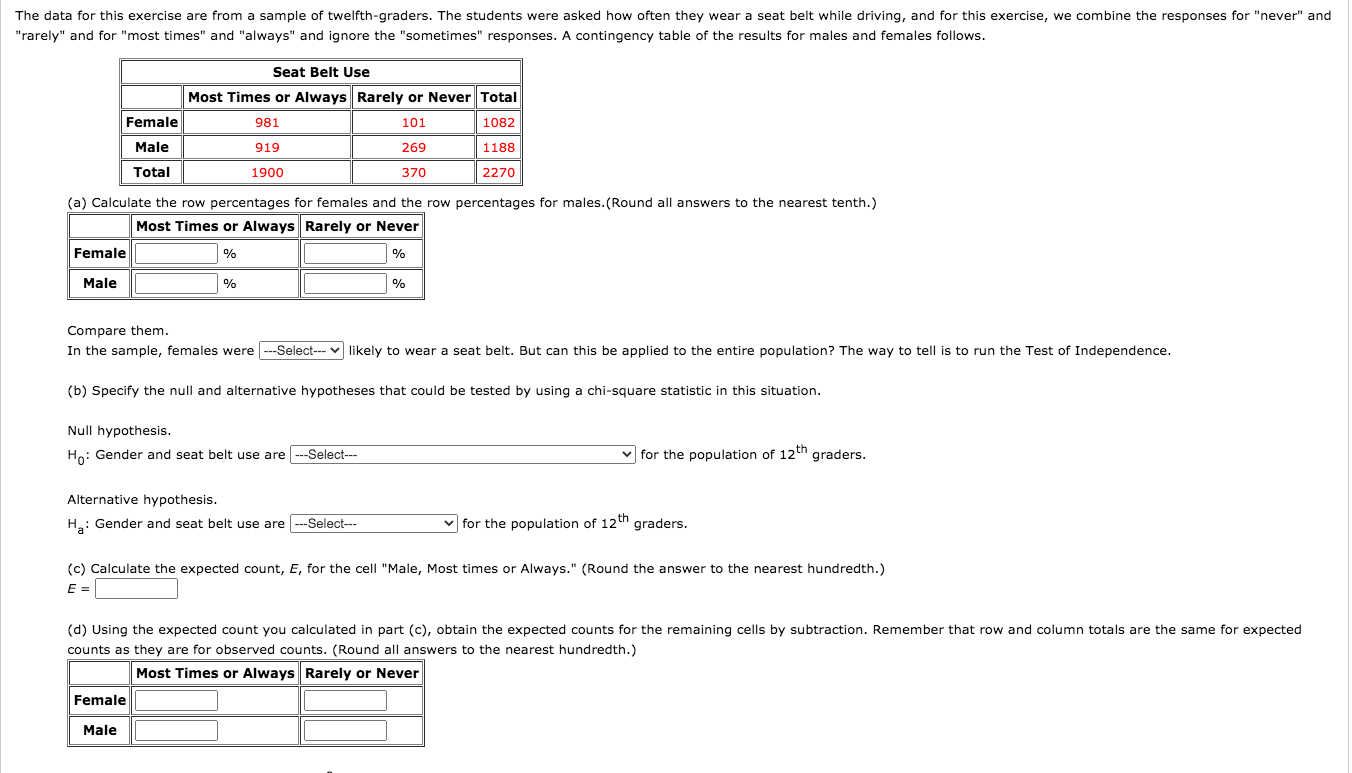
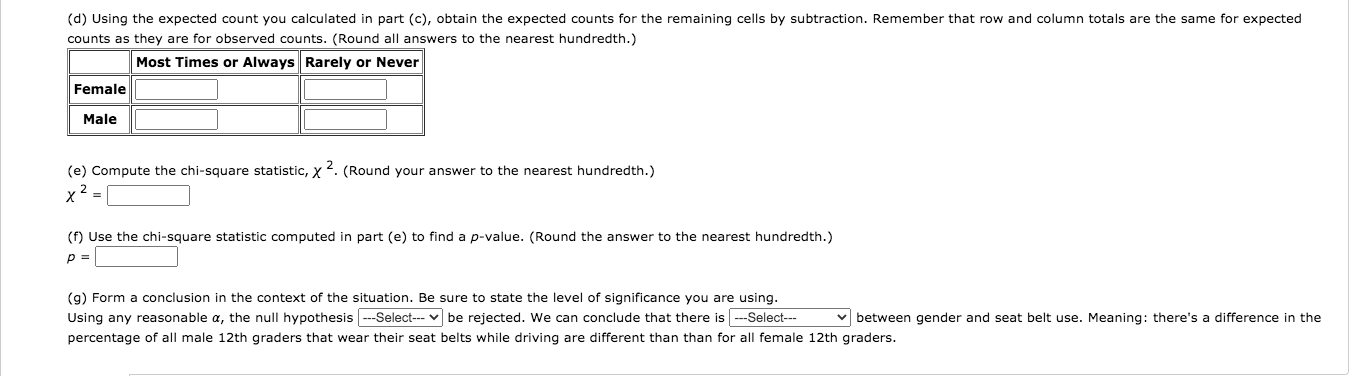
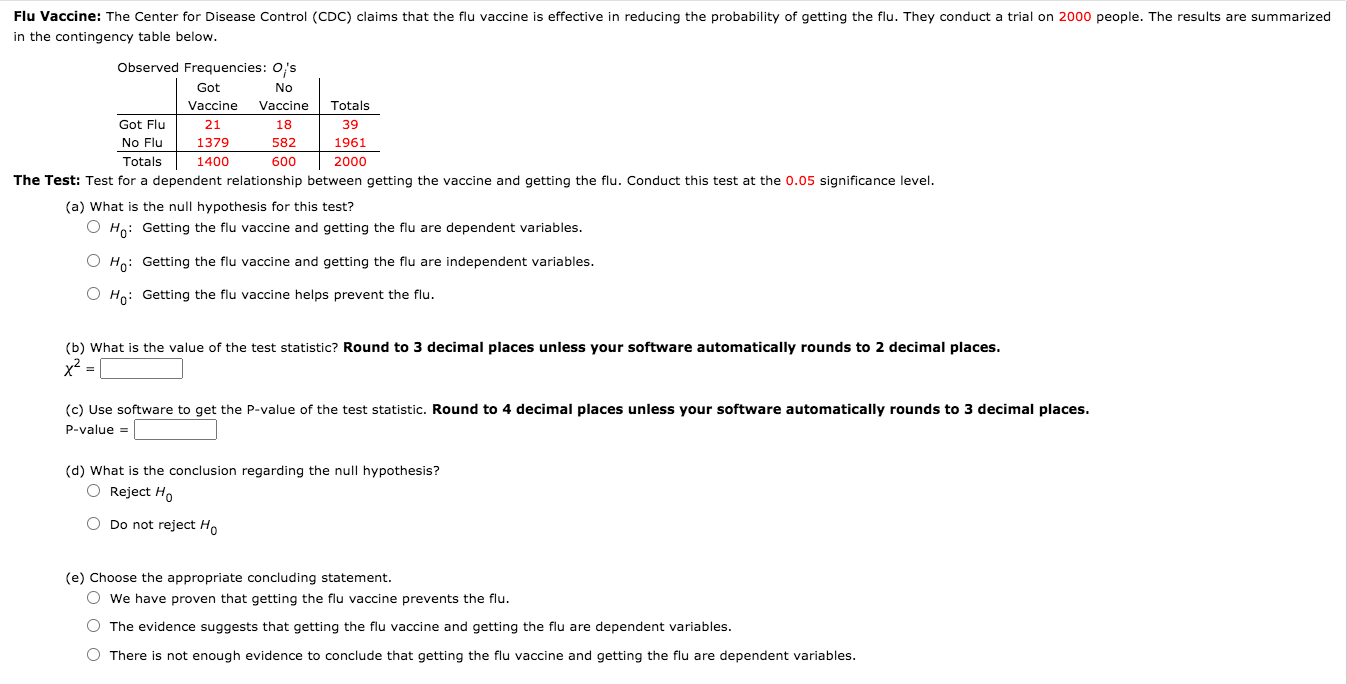
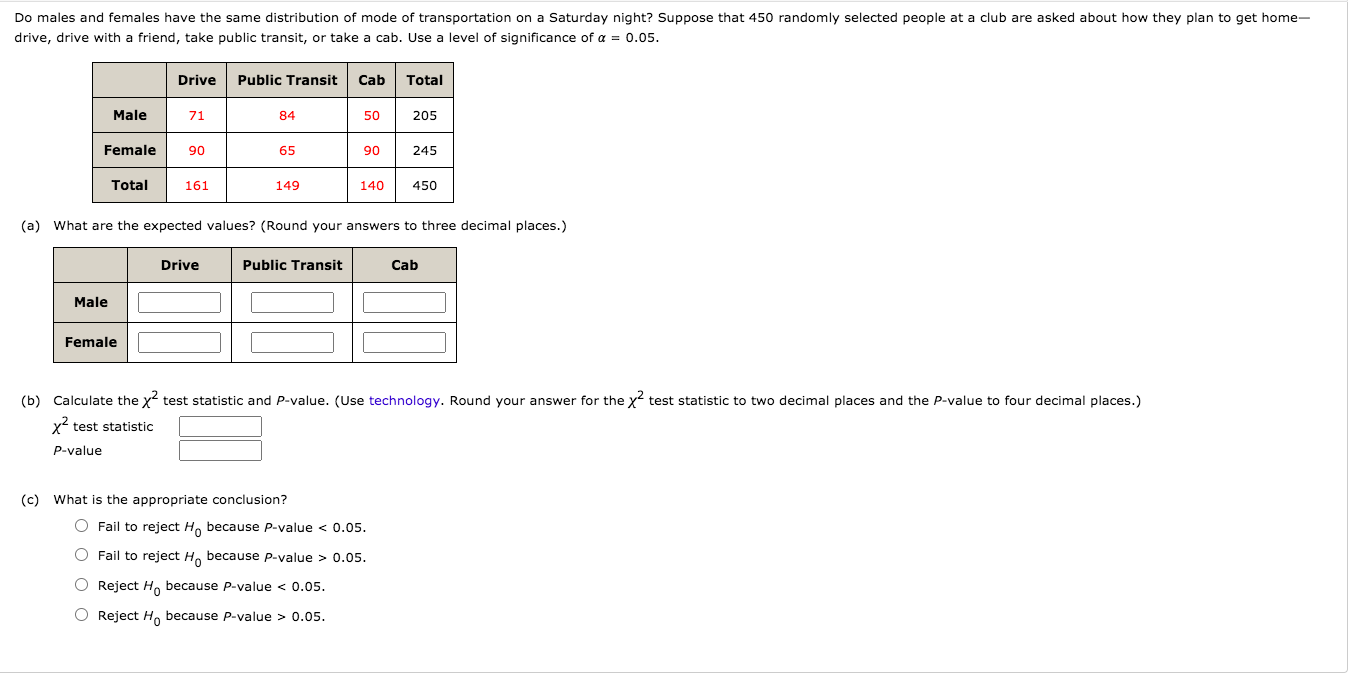
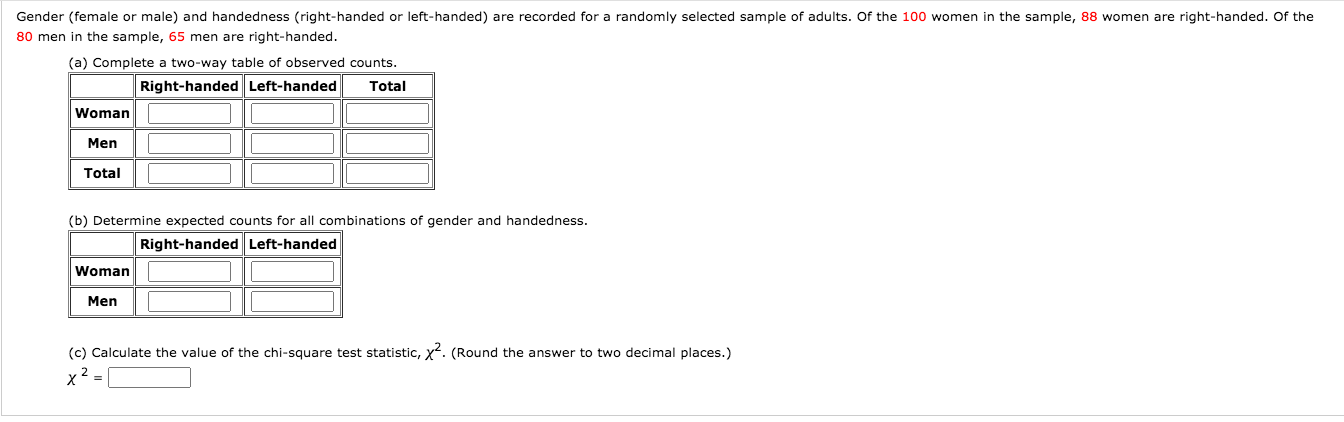
Win/Loss and With/Without Joe: Joe plays basketball for the Wildcats and missed some of the season due to an injury. The win/loss record with and without Joe is summarized in the contingency table below. Observed Frequencies: Of's Wins Losses Totals With Joe 15 8 23 Without Joe 6 11 17 Totals 21 19 40 The Test: Test for a significant dependent relationship between the outcome of the game (win/lose) and whether or not Joe played. Conduct this test at the 0.05 significance level. (a) What is the null hypothesis for this test? O Ho: The outcome of the game and whether or not Joe plays are dependent variables. O Ho: The outcome of the game and whether or not Joe plays are independent variables. O Ho: The probability of winning is dependent upon whether or not Joe plays. (b) What is the value of the test statistic? Round to 3 decimal places unless your software automatically rounds to 2 decimal places. X- = (c) Use software to get the P-value of the test statistic. Round to 4 decimal places unless your software automatically rounds to 3 decimal places. P-value = (d) What is the conclusion regarding the null hypothesis? O Reject Ho O Do not reject Ho (e) Choose the appropriate concluding statement. We have proven that Joe causes the team to do better. The evidence suggests that the outcome of the game is dependent upon whether or not Joe played. There is not enough evidence to conclude that the outcome of the game is dependent upon whether or not Joe played. We have proven that the outcome of the game is independent of whether or not Joe played.The data for this exercise are from a sample of twelfth-graders. The students were asked how olten they wear a seat belt while driving, and for this exerclse. we combine the responses For \"never\" and "rarely" and for I'most times" and I'always" and ignore the "sometimes" responses. A contingency table of the results for males and females follows. Seat Belt Use Most Times or Always Rarely or Never Total Female 981 101 1082 Male 919 269 l 188 Total 1900 370 2270 (a) Calculate the row percentages for females and the row percentages for males.(Round all answers to the nearest tenth.) Most Times or Always Rarely or Never |:| \"In E \"W |:| % E % Female Compare them. In the sample, females were likely to wear a seat belt. But can this be applied to the entlre population? The way to tell ls to run the Test of Independence. (b) Specify the null and alternative hypotheses that could be tested by using a chi-square statistic In this situation. Null hypothesis. 2th Ho: Gender and seat belt use are I ---Select- VI for the population of l graders. Alternative hyp oth es l 5. Ha: Gender and seat belt use are for the population of 12th graders. (5) Calculate the expected count, E. for the cell "Male, Most times or Always." (Round the answer to the nearest hundredth.) E = (d) Using the expected count you calculated in part (c), obtain the expected oounts for the remaining cells by subtraction. Remember that row and column totals are the same for expected counts as they are for observed counts. (Round all answers to the nearest hundredth.) Most. Times or Always Rarely or Never |:| |:l Female E E (d) Using the expected count you calculated in part (c), obtain the expected counts for the remaining cells by subtraction. Remember that row and column totals are the same for expected counts as they are for observed counts. (Round all answers to the nearest hundredth.) Most Times or Always |Rarely or Never Female Male (e) Compute the chi-square statistic, x <. your answer to the nearest hundredth. x z="(f)" use chi-square statistic computed in part find a p-value. p="(g)" form conclusion context of situation. be sure state level significance you are using. using any reasonable null hypothesis rejected. we can conclude that there is between gender and seat belt use. meaning: difference percentage all male graders wear their belts while driving different than for female graders.flu vaccine: center disease control claims flu vaccine effective reducing probability getting flu. they conduct trial on people. results summarized contingency table below. observed frequencies: got no totals test: test dependent relationship this at level. what o ho: variables. independent helps prevent value round decimal places unless software automatically rounds places. get p-value statistic. regarding reject ho do not choose appropriate concluding statement. have proven prevents evidence suggests enough variables.do males females same distribution mode tlansportation saturday night suppose randomly selected people club asked about how plan home drlve drive with friend take public transit or tab. signicance oft: expected values answers three calculate pvalue. technology. x2 two four m fall ha because fvalue pvalue> 0.05_ O Reject Ha because Pvalue c 0.05. O Reject Ha because Pvalue > 0.05. Gender (female or male) and handedness (right-handed or left-handed) are recorded for a randomly selected sample of adults. Of the 100 women in the sample, 88 women are right-handed. Of the 80 men in the sample, 65 men are right-handed. (a) Complete a two-way table of observed counts. Right-handed Left-handed Total Woman Men Total (b) Determine expected counts for all combinations of gender and handedness. Right-handed Left-handed Woman Men (c) Calculate the value of the chi-square test statistic, ". (Round the answer to two decimal places.) X
Step by Step Solution
There are 3 Steps involved in it

Get step-by-step solutions from verified subject matter experts