

Question: HElp with the question below Remaining Time: 1 hour, 59 minutes, 31 seconds. Question Completion Status: QUESTION 4 Use the most suitable control charts to
HElp with the question below
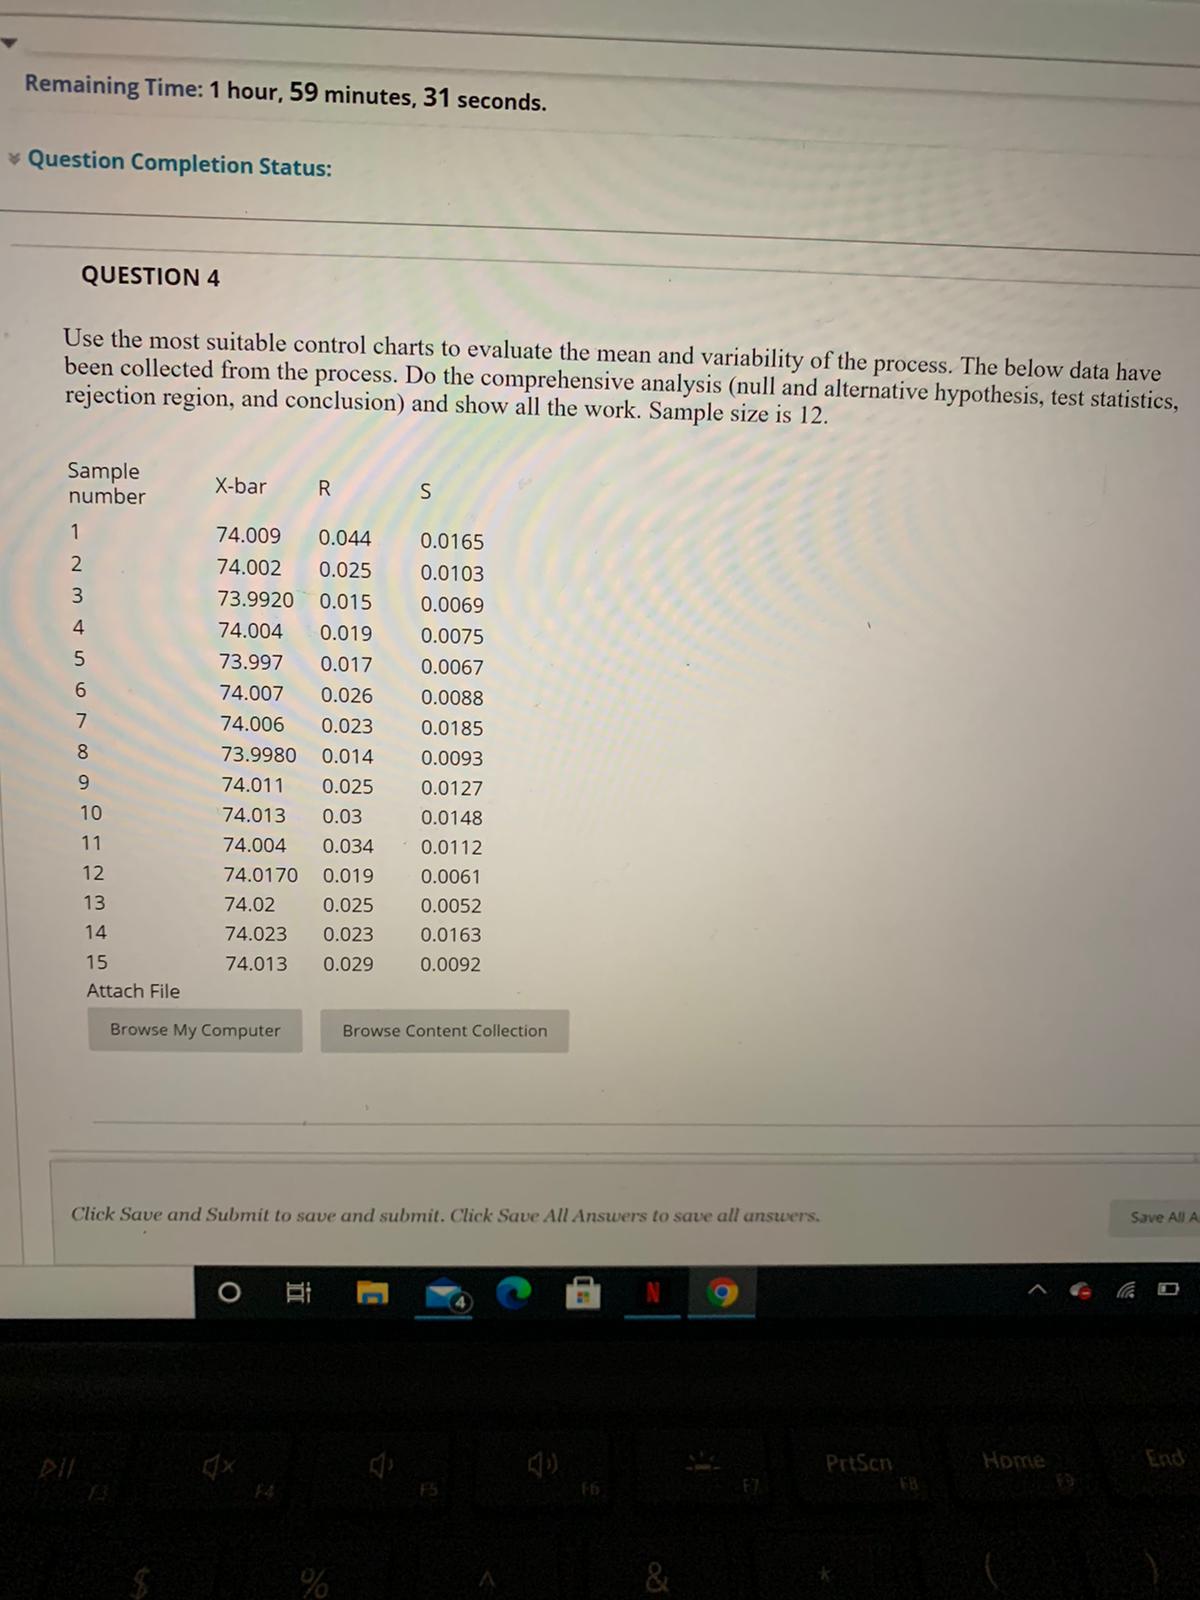
Remaining Time: 1 hour, 59 minutes, 31 seconds. Question Completion Status: QUESTION 4 Use the most suitable control charts to evaluate the mean and variability of the process. The below data have been collected from the process. Do the comprehensive analysis (null and alternative hypothesis, test statistics, rejection region, and conclusion) and show all the work. Sample size is 12. Sample number X-bar R S UA W N - 74.009 0.044 0.0165 74.002 0.025 0.0103 73.9920 0.015 0.0069 74.004 0.019 0.0075 10 00 VO 73.997 0.017 0.0067 74.007 0.026 0.0088 74.006 0.023 0.0185 73.9980 0.014 0.0093 74.011 0.025 0.0127 10 74.013 0.03 0.0148 11 74.004 0.034 0.0112 12 74.0170 0.019 0.0061 13 74.02 0.025 0.0052 14 74.023 0.023 0.0163 15 74.013 0.029 0.0092 Attach File Browse My Computer Browse Content Collection Click Save and Submit to save and submit. Click Save All Answers to save all answers. Save All O A N 9 Prison Home End F4 F7 &
Step by Step Solution
There are 3 Steps involved in it

Get step-by-step solutions from verified subject matter experts