

Question: Help with these from chapter 15 assignment please, distribution table at the bottom fArea Standard Normal Distribution 0.00 0.01 0.02 0.03 0.04 0.05 0.06 0.07
Help with these from chapter 15 assignment please, distribution table at the bottom
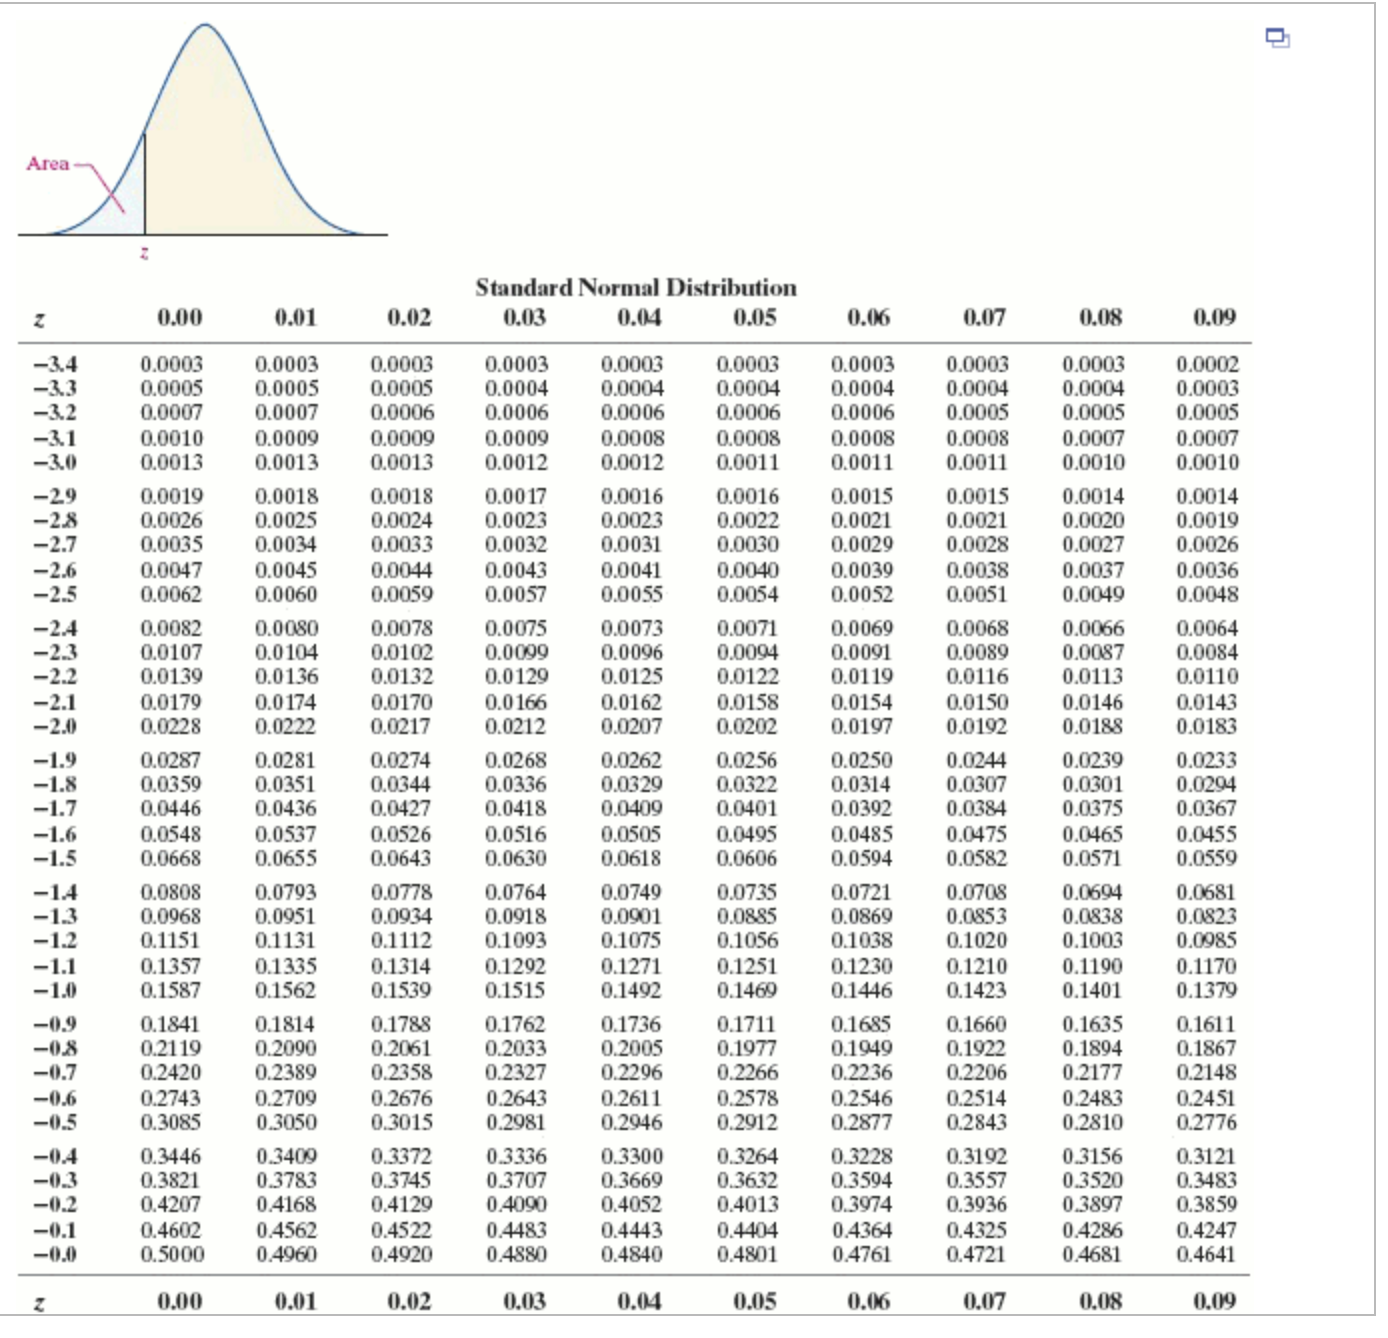
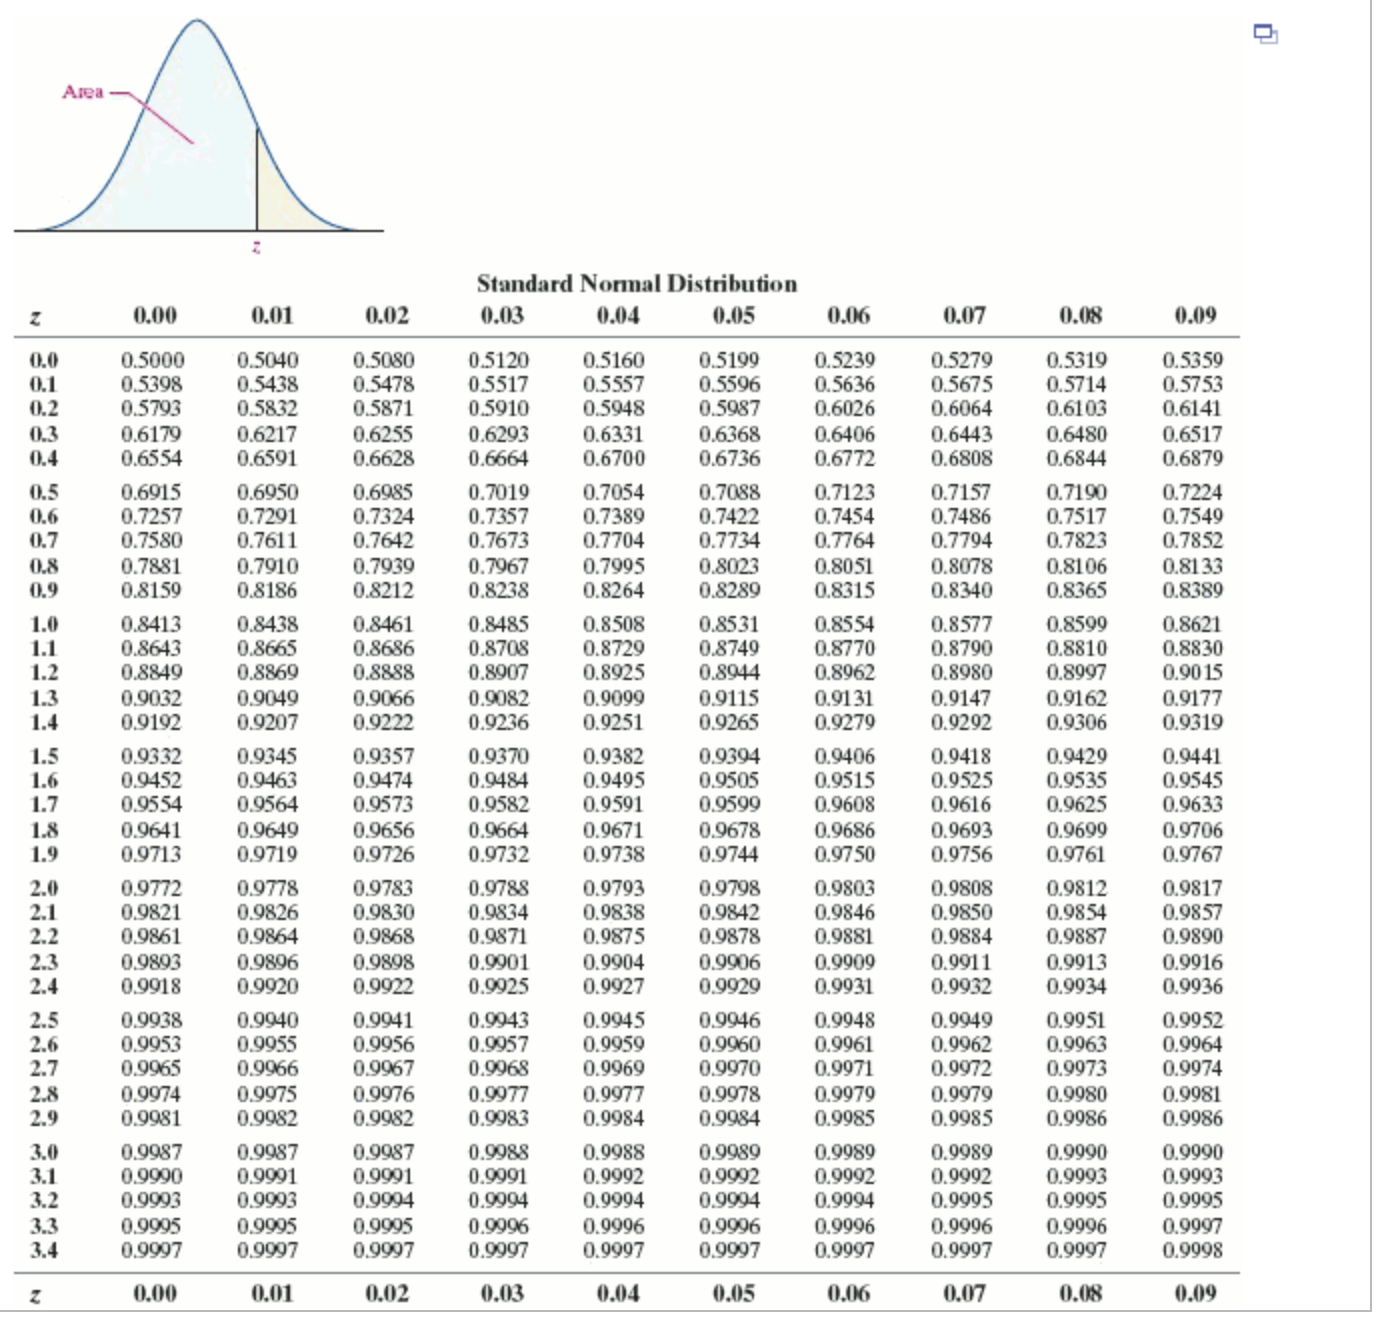
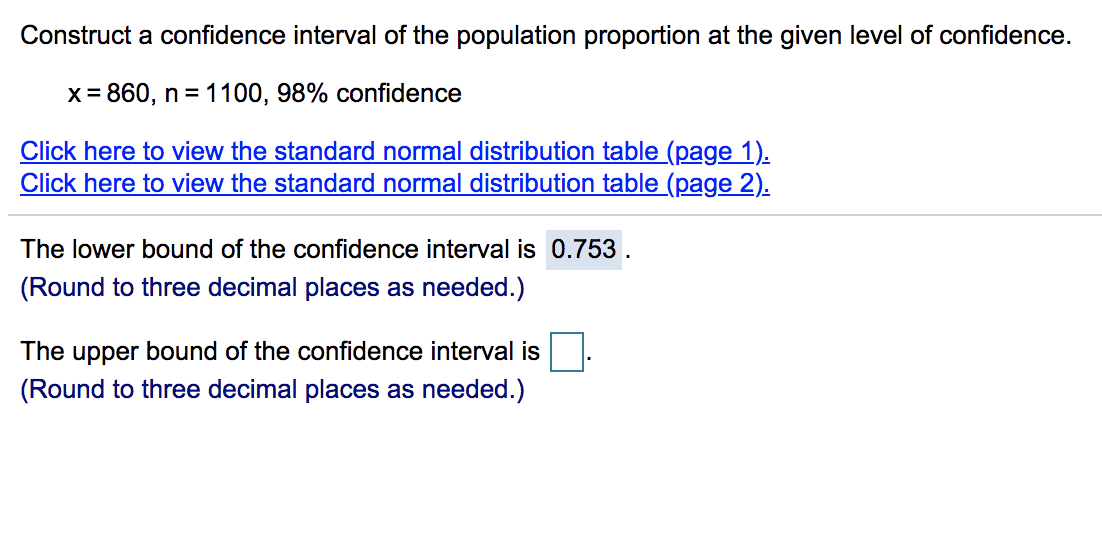
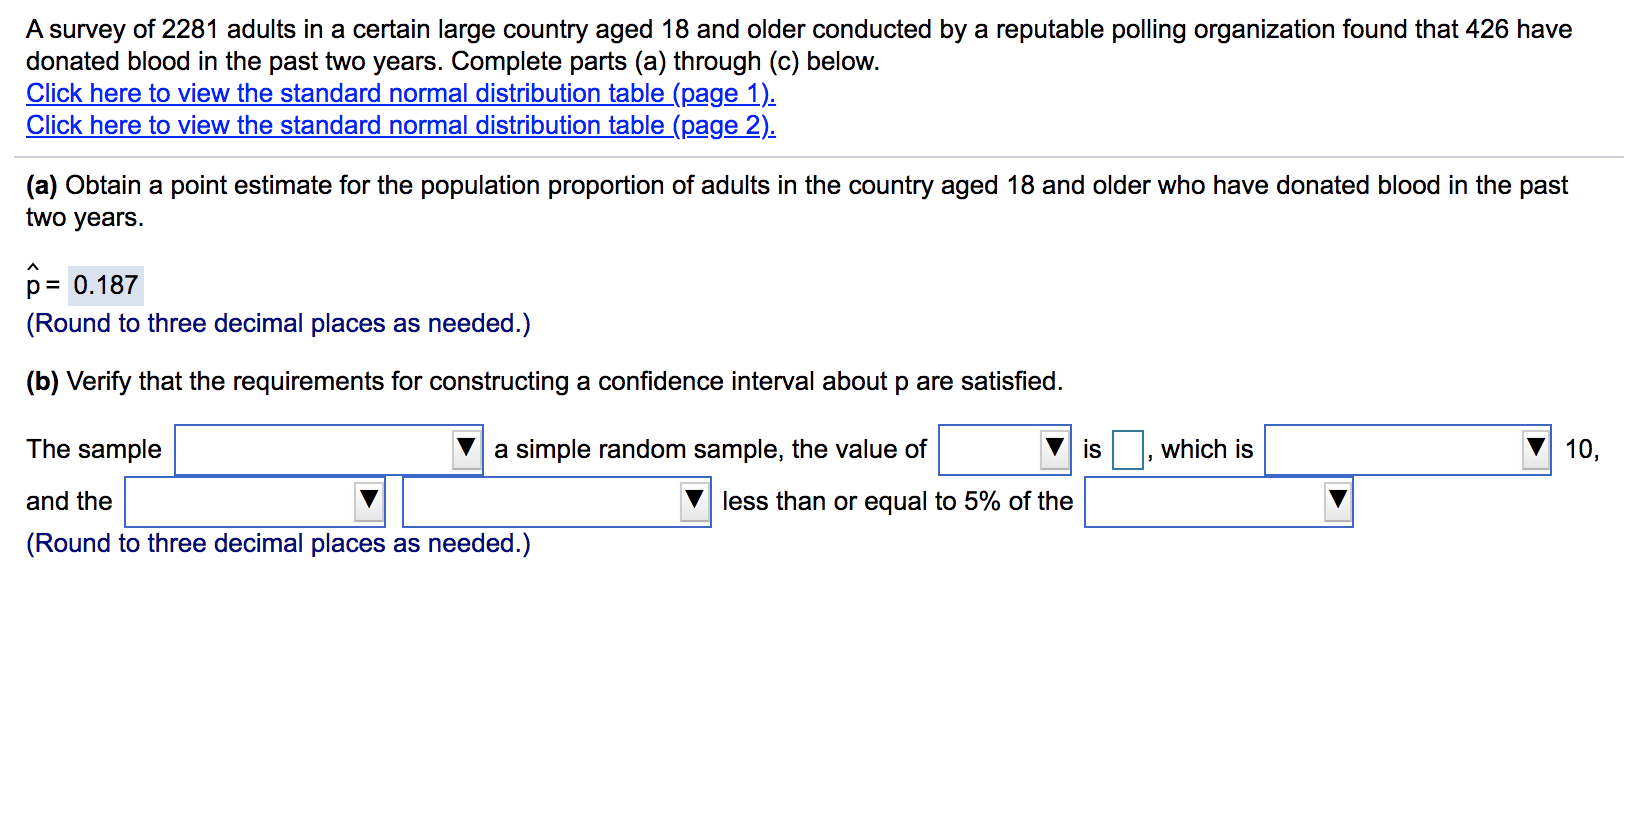
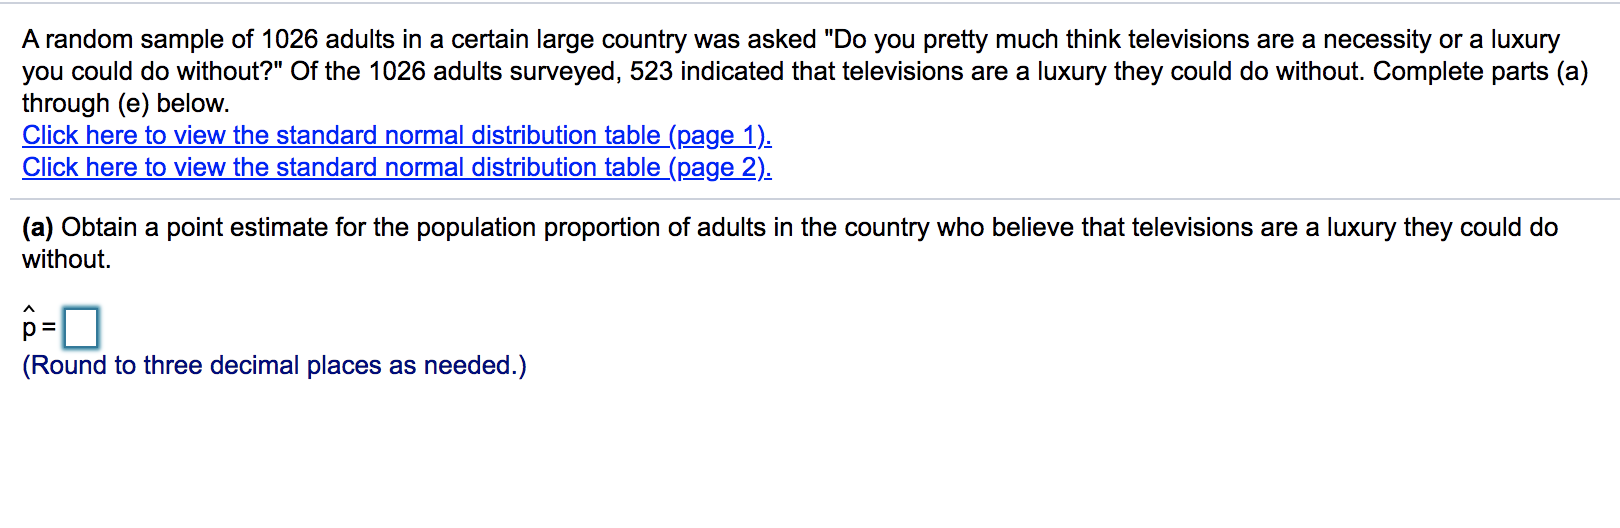
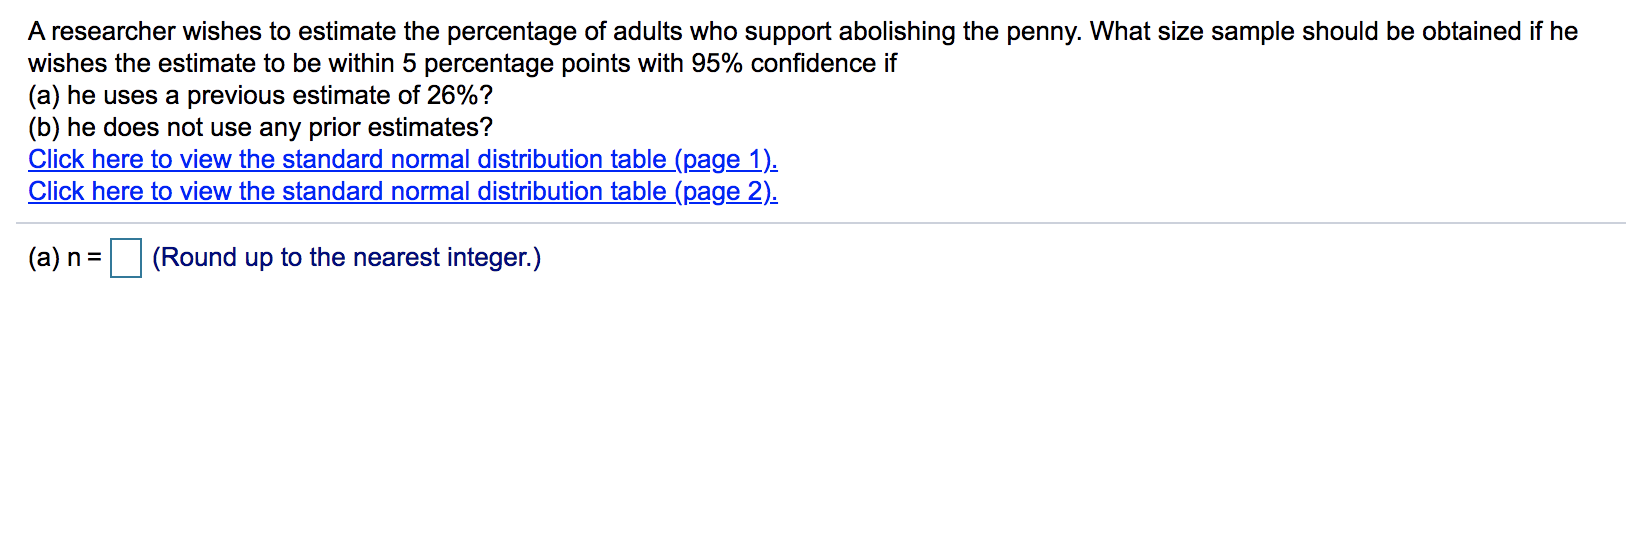
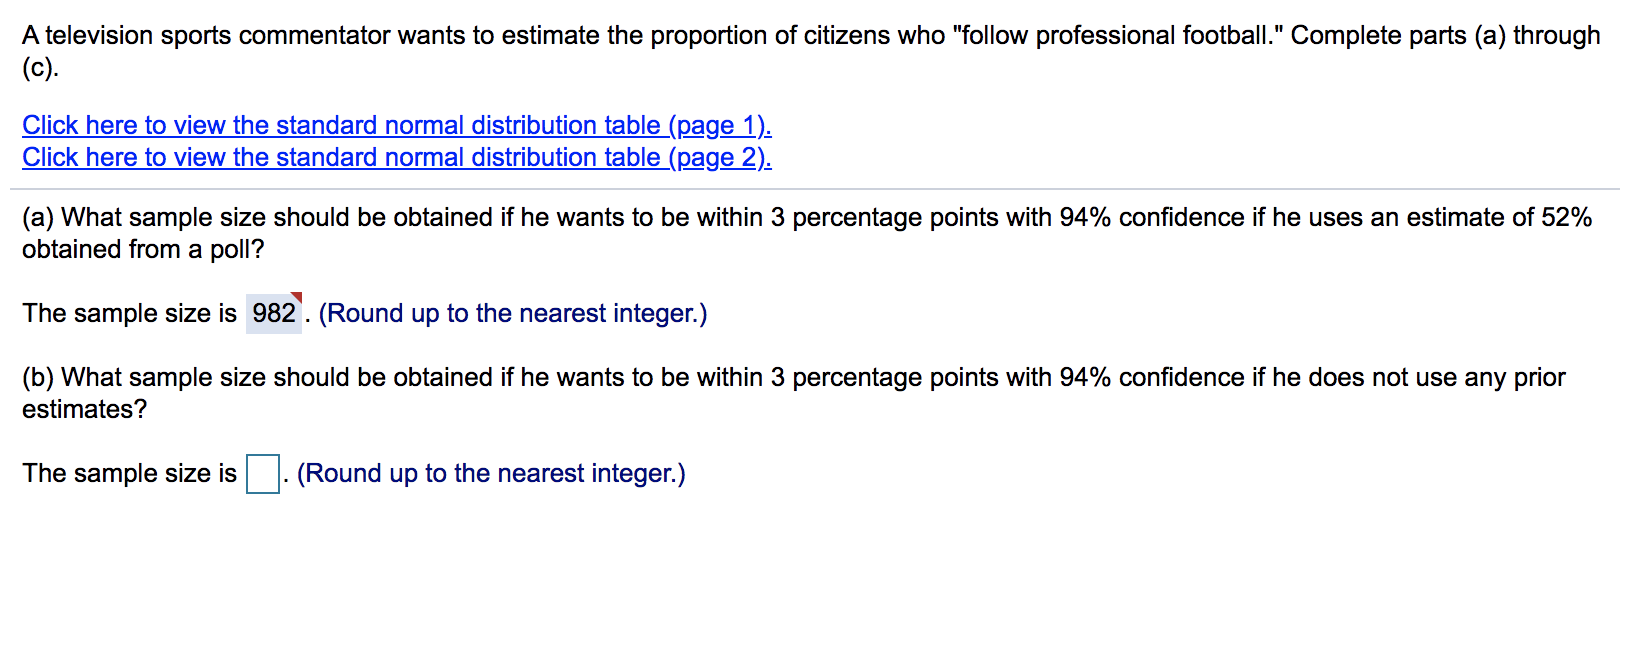
\fArea Standard Normal Distribution 0.00 0.01 0.02 0.03 0.04 0.05 0.06 0.07 0.08 0.09 0.0 0.5000 0.5040 0.5080 0.5120 0.5160 0.5199 0.5239 0.5279 0.5319 0.5359 0.1 0.5398 0.5438 0.5478 0.5517 0.5557 0.5596 0.5636 0.5675 0.5714 0.5753 0.2 0.5793 0.5832 0.5871 0.5910 0.5948 0.5987 0.6026 0.6064 0.6103 0.6141 0.3 0.6179 0.6217 0.6255 0.6293 0.6331 0.6368 0.6406 0.6443 0.6480 0.6517 0.4 0.6554 0.6591 0.6628 0.6664 0.6700 0.6736 0.6772 0.6808 0.6844 0.6879 0.5 0.6915 0.6950 0.6985 0.7019 0.7054 0.7088 0.7123 0.7157 0.7190 0.7224 0.6 0.7257 0.7291 0.7324 0.7357 0.7389 0.7422 0.7454 0.7486 0.7517 0.7549 0.7 0.7580 0.7611 0.7642 0.7673 0.7704 0.7734 0.7764 0.7794 0.7823 0.7852 0.8 0.7881 0.7910 0.7939 0.7967 0.7995 0.8023 0.8051 0.8078 0.8106 0.8133 0.9 0.8159 0.8186 0.8212 0.8238 0.8264 0.8289 0.8315 0.8340 0.8365 0.8389 1.0 0.8413 0.8438 0.8461 0.8485 0.8508 0.8531 0.8554 0.8577 0.8599 0.8621 0.8643 0.8665 0.8686 0.8708 0.8729 0.8749 0.8770 0.8790 0.8810 0.8830 0.8849 0.8869 0.8888 0.8907 0.8925 0.8944 0.8962 0.8980 0.8997 0.90 15 0.9032 0.9049 0.9066 0.9082 0.9099 0.9115 0.9131 0.9147 0.9162 0.9177 0.9192 0.9207 0.9222 0.9236 0.9251 0.9265 0.9279 0.9292 0.9306 0.9319 0.9332 0.9345 0.9357 0.9370 0.9382 0.9394 0.9406 0.9418 0.9429 0.9441 0.9452 0.9463 0.9474 0.9484 0.9495 0.9505 0.9515 0.9525 0.9535 0.9545 1.7 0.9554 0.9564 0.9573 0.9582 0.9591 0.9599 0.9608 0.9616 0.9625 0.9633 0.9641 0.9649 0.9656 0.9664 0.9671 0.9678 0.9686 0.9693 0.9699 0.9706 1.9 0.9713 0.9719 0.9726 0.9732 0.9738 0.9744 0.9750 0.9756 0.9761 0.9767 2.0 0.9772 0.9778 0.9783 0.9788 0.9793 0.9798 0.9803 0.9808 0.9812 0.9817 2.1 0.9821 0.9826 0.9830 0.9834 0.9838 0.9842 0.9846 0.9850 0.9854 0.9857 2.2 0.9861 0.9864 0.9868 0.9871 0.9875 0.9878 0.9881 0.9884 0.9887 0.9890 2.3 0.9893 0.9896 0.9898 0.9901 0.9904 0.9906 0.9909 0.9911 0.9913 0.9916 2.4 0.9918 0.9920 0.9922 0.9925 0.9927 0.9929 0.9931 0.9932 0.9934 0.9936 2.5 0.9938 0.9940 0.9941 0.9943 0.9945 0.9946 0.9948 0.9949 0.9951 0.9952 2.6 0.9953 0.9955 0.9956 0.9957 0.9959 0.9960 0.9961 0.9962 0.9963 0.9964 0.9965 0.9966 0.9967 0.9968 0.9969 0.9970 0.9971 0.9972 0.9973 0.9974 0.9974 0.9975 0.9976 0.9977 0.9977 0.9978 0.9979 0.9979 0.9980 0.9981 0.9981 0.9982 0.9982 0.9983 0.9984 0.9984 0.9985 0.9985 0.9986 0.9986 3.0 0.9987 0.9987 0.9987 0.9988 0.9988 0.9989 0.9989 0.9989 0.9990 0.9990 3.1 0.9990 0.9991 0.9091 0.9991 0.9992 0.9092 0.9992 0.9992 0.9993 0.9993 3.2 0.9993 0.9993 0.9994 0.9994 0.9994 0.9994 0.9994 0.9995 0.9995 0.9995 3.3 0.9995 0.9995 0.9995 0.9996 0.9996 0.9996 0.9996 0.9996 0.9996 0.9997 3.4 0.9997 0.9997 0.9997 0.9997 0.9997 0.9997 0.9997 0.9997 0.9997 0.9998 0.00 0.01 0.02 0.03 0.04 0.05 0.06 0.07 0.08 0.09Construct a confidence interval of the population proportion at the given level of confidence. x = 860, n = 1100, 98% confidence Click here to view the standard normal distribution table (page 1). Click here to view the standard normal distribution table (page 2). The lower bound of the confidence interval is 0.753 (Round to three decimal places as needed.) The upper bound of the confidence interval is (Round to three decimal places as needed.)A survey of 2281 adults in a certain large country aged 18 and older conducted by a reputable polling organization found that 426 have donated blood in the past two years. Complete parts (a) through (0) below. Click here to View the standard normal distribution table (page 1); Click here to View the standard normal distribution table (age2); (a) Obtain a point estimate for the population proportion of adults in the country aged 18 and older who have donated blood in the past two years. 6: 0.187 (Round to three decimal places as needed.) (b) Verify that the requirements for constructing a condence interval about p are satised. The sample and the a simple random sample, the value of : (Round to three decimal places as needed.) less than or equal to 5% of the is |:|, which is 10, A random sample of 1026 adults in a certain large country was asked "Do you pretty much think televisions are a necessity or a luxury you could do without?" Of the 1026 adults surveyed, 523 indicated that televisions are a luxury they could do without. Complete parts (a) through (e) below. Click here to View the standard normal distribution table (gage1); Click here to View the standard normal distribution table \"3962); (a) Obtain a point estimate for the population proportion of adults in the country who believe that televisions are a luxury they could do without. 6=o (Round to three decimal places as needed.) A researcher wishes to estimate the percentage of adults who support abolishing the penny. What size sample should be obtained if he wishes the estimate to be within 5 percentage points with 95% condence if (a) he uses a previous estimate of 26%? (b) he does not use any prior estimates? Click here to view the standard normal distribution table (Egg); Click here to view the standard normal distribution table (Egg); (a) n = D (Round up to the nearest integer.) Atelevision sports commentator wants to estimate the proportion of citizens who "follow professional football." Complete parts (a) through (6). Click here to View the standard normal distribution table (Egg); Click here to view the standard normal distribution table (gs2); (a) What sample size should be obtained if he wants to be within 3 percentage points with 94% condence if he uses an estimate of 52% obtained from a poll? The sample size is 982'. (Round up to the nearest integer.) (b) What sample size should be obtained if he wants to be within 3 percentage points with 94% condence if he does not use any prior estimates? The sample size is D. (Round up to the nearest integer.)
Step by Step Solution
There are 3 Steps involved in it

Get step-by-step solutions from verified subject matter experts