

Question: Help with this please The following graph plots equilibrium in the money market at an interest rate of ( 6 % )
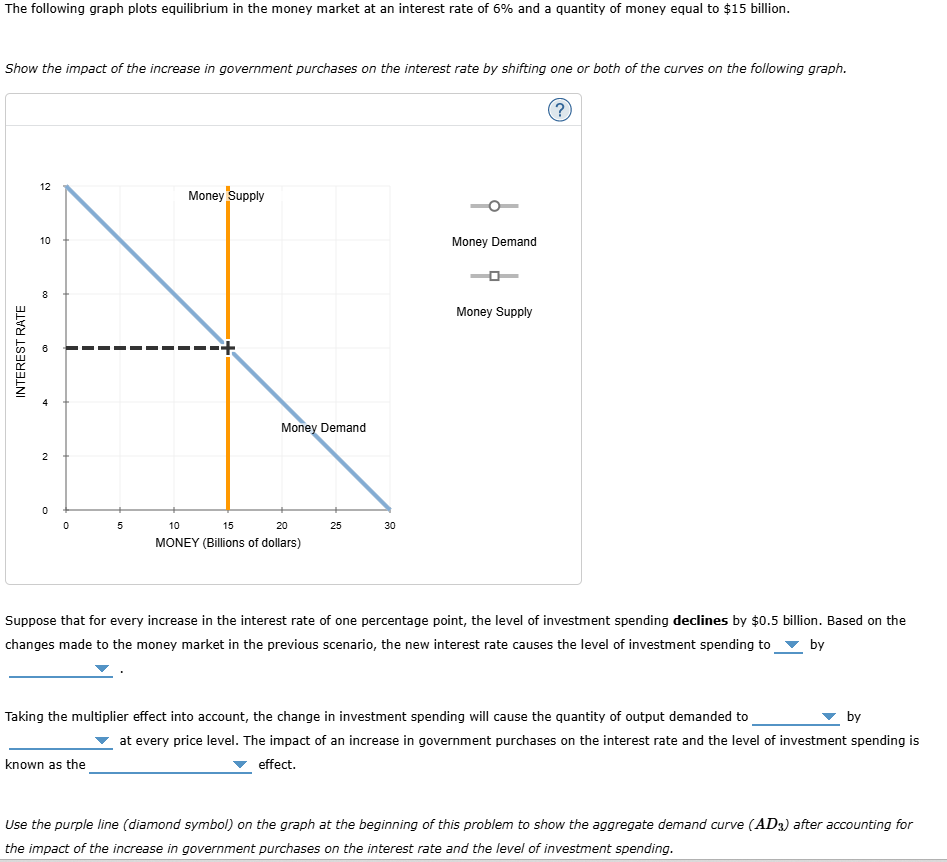
Help with this please The following graph plots equilibrium in the money market at an interest rate of and a quantity of money equal to $ billion.
Show the impact of the increase in government purchases on the interest rate by shifting one or both of the curves on the following graph.
Suppose that for every increase in the interest rate of one percentage point, the level of investment spending declines by $ billion. Based on the changes made to the money market in the previous scenario, the new interest rate causes the level of investment spending to qquad by
Taking the multiplier effect into account, the change in investment spending will cause the quantity of output demanded to by
known as the at every price level. The impact of an increase in government purchases on the interest rate and the level of investment spending is
square effect.
Use the purple line diamond symbol on the graph at the beginning of this problem to show the aggregate demand curve A D after accounting for the impact of the increase in government purchases on the interest rate and the level of investment spending. The following graph plots equilibrium in the money market at an interest rate of and a quantity of money equal to $ billion.
Show the impact of the increase in government purchases on the interest rate by shifting one or both of the curves on the following graph.
Suppose that for every increase in the interest rate of one percentage point, the level of investment spending declines by $ billion. Based on the changes made to the money market in the previous scenario, the new interest rate causes the level of investment spending to qquad by
Taking the multiplier effect into account, the change in investment spending will cause the quantity of output demanded to by
known as the at every price level. The impact of an increase in government purchases on the interest rate and the level of investment spending is
square effect.
Use the purple line diamond symbol on the graph at the beginning of this problem to show the aggregate demand curve A D after accounting for the impact of the increase in government purchases on the interest rate and the level of investment spending.
Step by Step Solution
There are 3 Steps involved in it
1 Expert Approved Answer
Step: 1 Unlock

Question Has Been Solved by an Expert!
Get step-by-step solutions from verified subject matter experts
Step: 2 Unlock
Step: 3 Unlock