

Question: Help with this question and the solution for future reference pls and thxxx In the following probability distribution, the random variable x represents the number
Help with this question and the solution for future reference pls and thxxx
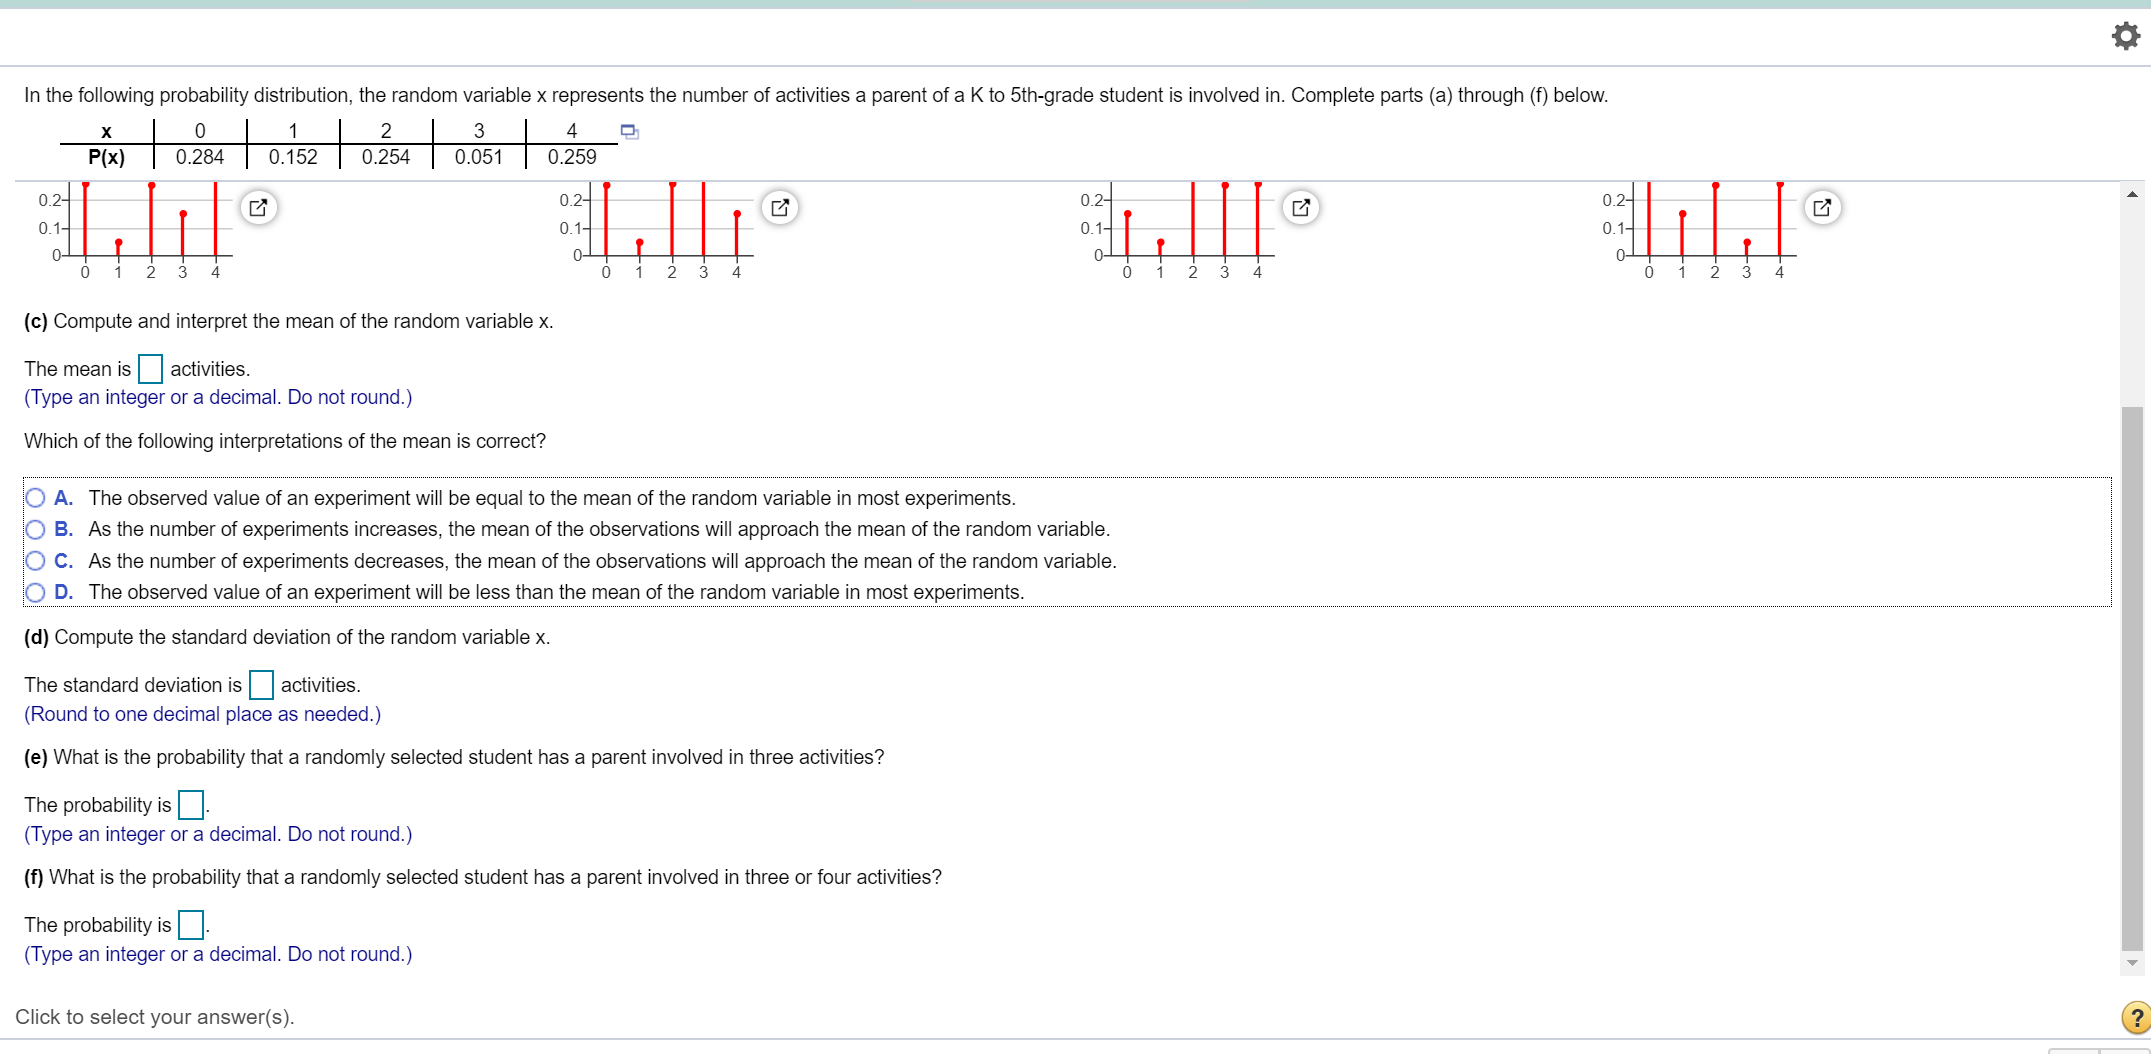
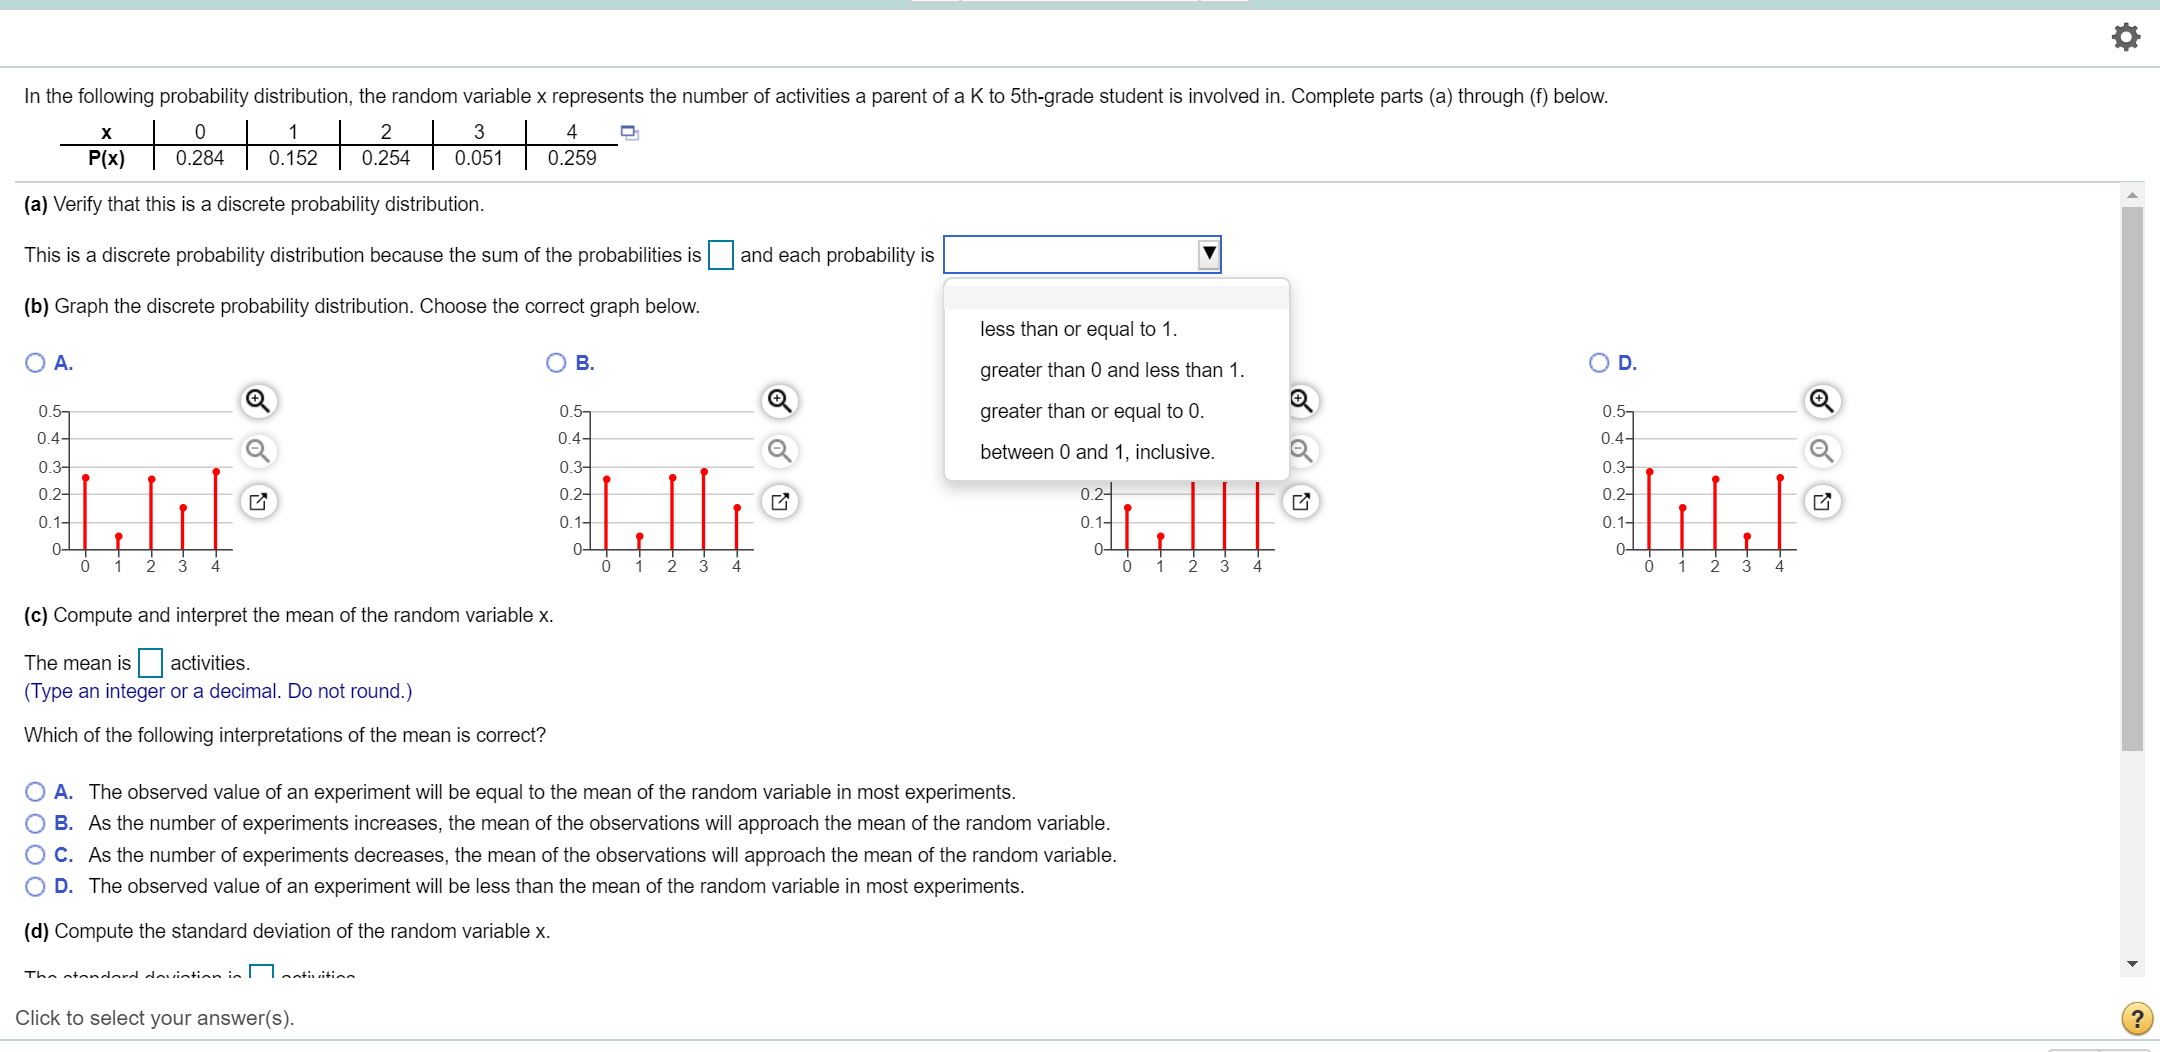
In the following probability distribution, the random variable x represents the number of activities a parent of a K to 5th-grade student is involved in. Complete parts (a) through (f) below. x|o|1|2|3|49l P(x) | 0.284 | 0.152 | 0.254 | 0.051 | 0.259 0? @ u @ 01- 01 D- 34 01234 012 (c) Compute and interpret the mean of the random variable x. The mean is activities. (Type an integer or a decimal. Do not round.) Which of the following interpretations of the mean is correct? 0 A. The observed value of an experiment will be equal to the mean of the random variable in most experiments. 02- 01- O B. As the number of experiments increases, the mean of the observations will approach the mean of the random variable. 0 C. As the number of experiments decreases, the mean of the observations will approach the mean of the random variable. 0 D. The observed value of an experiment will be less than the mean of the random variable in most experiments. (d) Compute the standard deviation of the random variable x. The standard deviation is activities. (Round to one decimal place as needed.) (e) What is the probability that a randomly selected student has a parent involved in three activities? The probability is . (Type an integer or a decimal. Do not round.) (f) What is the probability that a randomly selected student has a parent involved in three orfour activities? The probability is . (Type an integer or a decimal. Do not round.) Click to select your answer(s). aw 02- 01 In the following probability distribution, the random variable x represents the number of activities a parent of a K to 5thgrade student is involved in. Complete parts (a) through (f) below. x | 0 1 | 2 | 3 | 4 E: P(x) | 0.284 0.152 | 0.254 | 0.051 | 0.259 (a) Verify that this is a discrete probability distribution. This is a discrete probability distribution because the sum of the probabilities is (b) Graph the discrete probability distribution. Choose the correct graph below. OA. 0 B. 05. 05- 04- 03 03 Q 02- @ 02- 01 01- 0- o- 0 1 2 3 4 (1:) Compute and interpret the mean of the random variable x. 04 The mean is activities. (Type an integer or a decimal. Do not round.) Which of the following interpretations of the mean is correct? :I and each probability is : less than or equal to 1. greater than 0 and less than 1. greater than or equal to D. E') between 0 and 1, inclusive. a @ 0.1- D- 0 1 2 3 4 O A. The observed value of an experiment will be equal to the mean of the random variable in most experiments. 0 B. As the number of experiments increases, the mean of the observations will approach the mean of the random variable. 0 (2. As the number of experiments decreases, the mean of the observations will approach the mean of the random variable. 0 D. The observed value of an experiment will be less than the mean of the random variable in most experiments. (d) Compute the standard deviation of the random variable x. -:.l_l.. n... -A-...1_..1 .r-.. Click to select your answer(s). OD. 05- 04 03 02- 01
Step by Step Solution
There are 3 Steps involved in it

Get step-by-step solutions from verified subject matter experts