

Question: *Help with trying to come up with a chart or pivot chart to answer the questions. Youve introduced your post by explaining the importance of
*Help with trying to come up with a chart or pivot chart to answer the questions.
Youve introduced your post by explaining the importance of data analysis, and youve told the story of your products launch. Now its time to summarize your most important findings with data visualizations to help employees and fellow company leaders understand your insights about the product launch data.
Consider creating data visualizations that illustrate the following information:
- How have the costs of goods sold (COGS) changed over the course of the year?
- How has the profit percentage changed over the course of the year?
Keep your target audience in mind as you choose which data visualizations to use. Look for visualizations that best highlight the most useful information in a way that will be easiest for your coworkers to interpret.
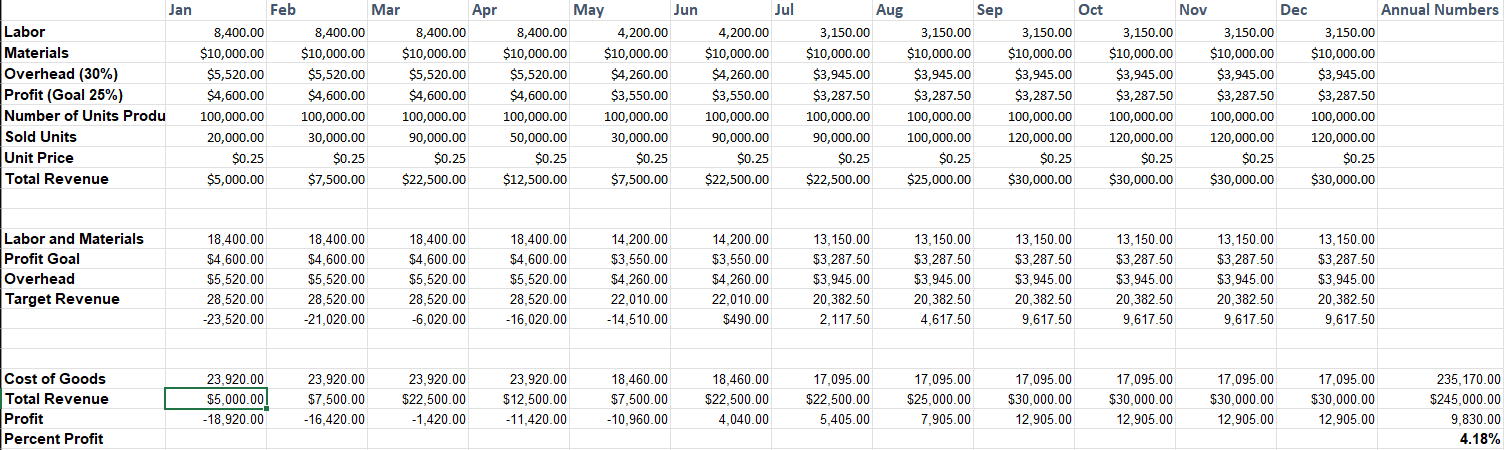
Jul Jan Labor Materials Overhead (30%) Profit (Goal 25%) Number of Units Produ Sold Units Unit Price Total Revenue Feb Mar Apr May Jun 8,400.00 8,400.00 8,400.00 8,400.00 4,200.00 $10,000.00 $10,000.00 $10,000.00 $10,000.00 $10,000.00 $5,520.00 $5,520.00 $5,520.00 $5,520.00 $4,260.00 $4,600.00 $4,600.00 $4,600.00 $4,600.00 $3,550.00 100,000.00 100,000.00 100,000.00 100,000.00 100,000.00 20,000.00 30,000.00 90,000.00 50,000.00 30,000.00 $0.25 $0.25 $0.25 $0.25 $0.25 $5,000.00 $7,500.00 $22,500.00 $12,500.00 $7,500.00 4,200.00 $10,000.00 $4,260.00 $3,550.00 100,000.00 90,000.00 $0.25 $22,500.00 Aug Sep Oct Nov Dec Annual Numbers 3,150.00 3,150.00 3,150.00 3,150.00 3,150.00 3,150.00 $10,000.00 $10,000.00 $10,000.00 $10,000.00 $10,000.00 $10,000.00 $3,945.00 $3,945.00 $3,945.00 $3,945.00 $3,945.00 $3,945.00 $3,287.50 $3,287.50 $3,287.50 $3,287.50 $3,287.50 $3,287.50 100,000.00 100,000.00 100,000.00 100,000.00 100,000.00 100,000.00 90,000.00 100,000.00 120,000.00 120,000.00 120,000.00 120,000.00 $0.25 $0.25 $0.25 $0.25 $0.25 $0.25 $22,500.00 $ $25,000.00 $30,000.00 $30,000.00 $30,000.00 $30,000.00 Labor and Materials Profit Goal Overhead Target Revenue 18,400.00 $4,600.00 $5,520.00 28,520.00 -23,520.00 18,400.00 $4,600.00 $5,520.00 28,520.00 -21,020.00 18,400.00 $4,600.00 $5,520.00 28,520.00 -6,020.00 18,400.00 $4,600.00 $5,520.00 28,520.00 - 16,020.00 14,200.00 $3,550.00 $4,260.00 22,010.00 - 14,510.00 14,200.00 $3,550.00 $4,260.00 22.010.00 $490.00 13,150.00 $3,287.50 $3,945.00 20,382.50 2,117.50 13,150.00 $3.287.50 $3,945.00 20,382.50 4,617.50 13,150.00 $3,287.50 $3,945.00 20,382.50 9,617.50 13,150.00 $3,287.50 $3,945.00 20,382.50 9,617.50 13,150.00 $3,287.50 $3,945.00 20,382.50 9,617.50 13,150.00 $3,287.50 $3,945.00 20,382.50 9,617.50 Cost of Goods Total Revenue Profit Percent Profit 23,920.00 $5,000.00 -18,920.00 23,920.00 $7,500.00 -16,420.00 23,920.00 $22,500.00 -1,420.00 23,920.00 $12,500.00 -11,420.00 18,460.00 $7,500.00 -10,960.00 18,460.00 $22,500.00 4,040.00 17,095.00 $22,500.00 5,405.00 17,095.00 $25,000.00 7,905.00 17,095.00 $30,000.00 12,905.00 17,095.00 $30,000.00 12,905.00 17,095.00 $30,000.00 12,905.00 17,095.00 $30,000.00 12,905.00 235,170.00 $245,000.00 9,830.00 4.18% Jul Jan Labor Materials Overhead (30%) Profit (Goal 25%) Number of Units Produ Sold Units Unit Price Total Revenue Feb Mar Apr May Jun 8,400.00 8,400.00 8,400.00 8,400.00 4,200.00 $10,000.00 $10,000.00 $10,000.00 $10,000.00 $10,000.00 $5,520.00 $5,520.00 $5,520.00 $5,520.00 $4,260.00 $4,600.00 $4,600.00 $4,600.00 $4,600.00 $3,550.00 100,000.00 100,000.00 100,000.00 100,000.00 100,000.00 20,000.00 30,000.00 90,000.00 50,000.00 30,000.00 $0.25 $0.25 $0.25 $0.25 $0.25 $5,000.00 $7,500.00 $22,500.00 $12,500.00 $7,500.00 4,200.00 $10,000.00 $4,260.00 $3,550.00 100,000.00 90,000.00 $0.25 $22,500.00 Aug Sep Oct Nov Dec Annual Numbers 3,150.00 3,150.00 3,150.00 3,150.00 3,150.00 3,150.00 $10,000.00 $10,000.00 $10,000.00 $10,000.00 $10,000.00 $10,000.00 $3,945.00 $3,945.00 $3,945.00 $3,945.00 $3,945.00 $3,945.00 $3,287.50 $3,287.50 $3,287.50 $3,287.50 $3,287.50 $3,287.50 100,000.00 100,000.00 100,000.00 100,000.00 100,000.00 100,000.00 90,000.00 100,000.00 120,000.00 120,000.00 120,000.00 120,000.00 $0.25 $0.25 $0.25 $0.25 $0.25 $0.25 $22,500.00 $ $25,000.00 $30,000.00 $30,000.00 $30,000.00 $30,000.00 Labor and Materials Profit Goal Overhead Target Revenue 18,400.00 $4,600.00 $5,520.00 28,520.00 -23,520.00 18,400.00 $4,600.00 $5,520.00 28,520.00 -21,020.00 18,400.00 $4,600.00 $5,520.00 28,520.00 -6,020.00 18,400.00 $4,600.00 $5,520.00 28,520.00 - 16,020.00 14,200.00 $3,550.00 $4,260.00 22,010.00 - 14,510.00 14,200.00 $3,550.00 $4,260.00 22.010.00 $490.00 13,150.00 $3,287.50 $3,945.00 20,382.50 2,117.50 13,150.00 $3.287.50 $3,945.00 20,382.50 4,617.50 13,150.00 $3,287.50 $3,945.00 20,382.50 9,617.50 13,150.00 $3,287.50 $3,945.00 20,382.50 9,617.50 13,150.00 $3,287.50 $3,945.00 20,382.50 9,617.50 13,150.00 $3,287.50 $3,945.00 20,382.50 9,617.50 Cost of Goods Total Revenue Profit Percent Profit 23,920.00 $5,000.00 -18,920.00 23,920.00 $7,500.00 -16,420.00 23,920.00 $22,500.00 -1,420.00 23,920.00 $12,500.00 -11,420.00 18,460.00 $7,500.00 -10,960.00 18,460.00 $22,500.00 4,040.00 17,095.00 $22,500.00 5,405.00 17,095.00 $25,000.00 7,905.00 17,095.00 $30,000.00 12,905.00 17,095.00 $30,000.00 12,905.00 17,095.00 $30,000.00 12,905.00 17,095.00 $30,000.00 12,905.00 235,170.00 $245,000.00 9,830.00 4.18%
Step by Step Solution
There are 3 Steps involved in it

Get step-by-step solutions from verified subject matter experts