

Question: Help writing Python code to open the file and help finding the min and max change from 1969 to 2015 Thank you! The lines of
Help writing Python code to open the file and help finding the min and max change from 1969 to 2015
Thank you!
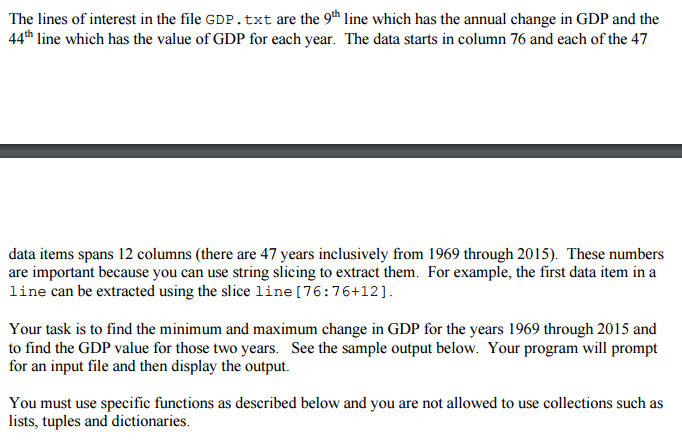
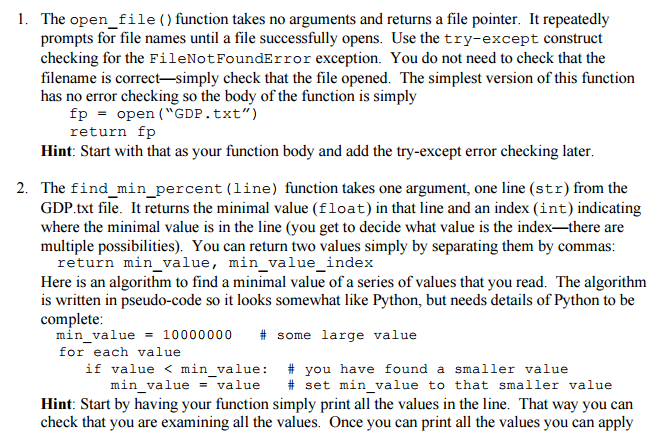
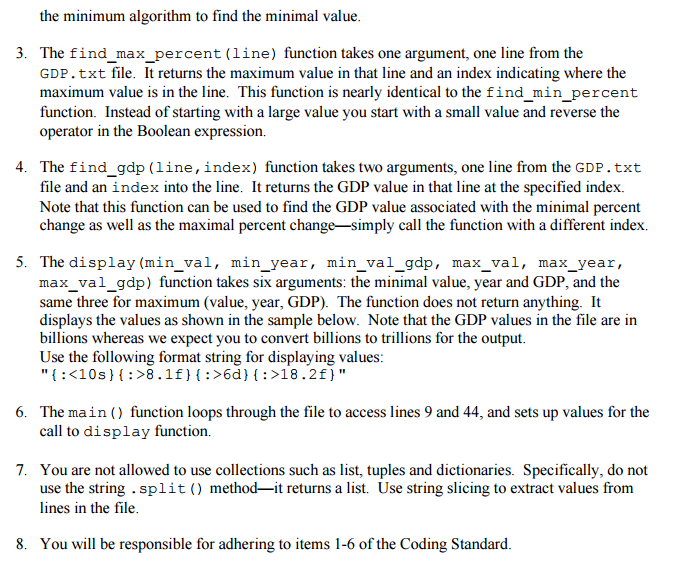
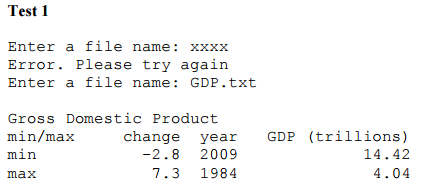
The lines of interest in the file GDP.txt are the 9 line which has the annual change in GDP and the 44th line which has the value of GDP for each year. The data starts in column 76 and each of the 47 data items spans 12 columns (there are 47 years inclusively from 1969 through 2015). These numbers are important because you can use string slicing to extract them. For example, the first data item in a line can be extracted using the slice line [76:76+12] Your task is to find the minimum and maximum change in GDP for the years 1969 through 2015 and to find the GDP value for those two years. See the sample output below. Your program will prompt for an input file and then display the output. You must use specific functions as described below and you are not allowed to use collections such as lists, tuples and dictionaries
Step by Step Solution
There are 3 Steps involved in it

Get step-by-step solutions from verified subject matter experts