

Question: helpppppppppp (c) Data Table 4 shows data taken in a free-fall experiment. Measurements were made of the distance of fall (y) at each of four

helpppppppppp
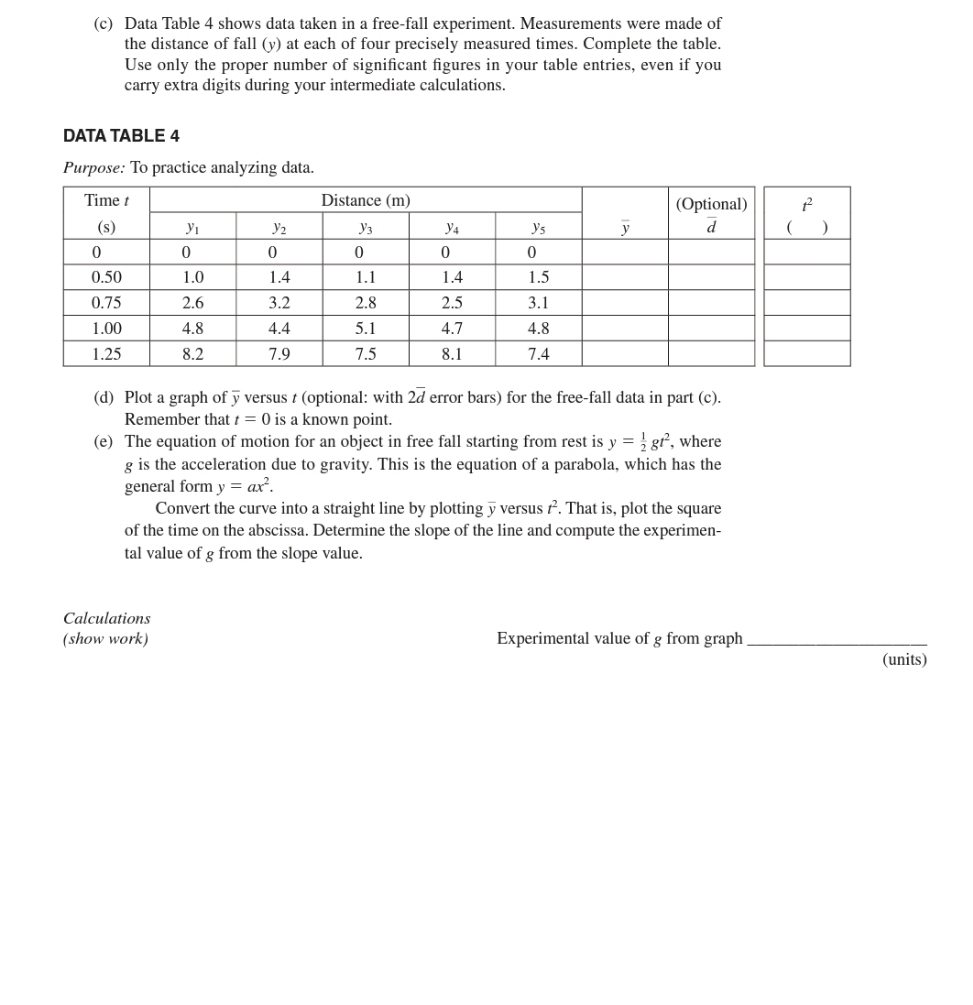
(c) Data Table 4 shows data taken in a free-fall experiment. Measurements were made of the distance of fall (y) at each of four precisely measured times. Complete the table. Use only the proper number of significant figures in your table entries, even if you carry extra digits during your intermediate calculations. DATA TABLE 4 Purpose: To practice analyzing data. Time t Distance (m) (Optional) (s) y2 y3 y4 y's d 0 0 0 0 0 0 0.50 1.0 1.4 1.1 1.4 1.5 0.75 2.6 3.2 2.8 2.5 3.1 1.00 4.8 4.4 5.1 4.7 4.8 1.25 8.2 7.9 7.5 8.1 7.4 (d) Plot a graph of y versus t (optional: with 2d error bars) for the free-fall data in part (c). Remember that / = 0 is a known point. (e) The equation of motion for an object in free fall starting from rest is y = ? gr, where g is the acceleration due to gravity. This is the equation of a parabola, which has the general form y = ax. Convert the curve into a straight line by plotting y versus . That is, plot the square of the time on the abscissa. Determine the slope of the line and compute the experiment tal value of g from the slope value. Calculations (show work) Experimental value of g from graph (units)
Step by Step Solution
There are 3 Steps involved in it

Get step-by-step solutions from verified subject matter experts