

Question: Hercules Exercise Equipment Co. purchased a computerized measuring device two years ago for $90,000. The equipment falls into the five-year category for MACRS depreciation and
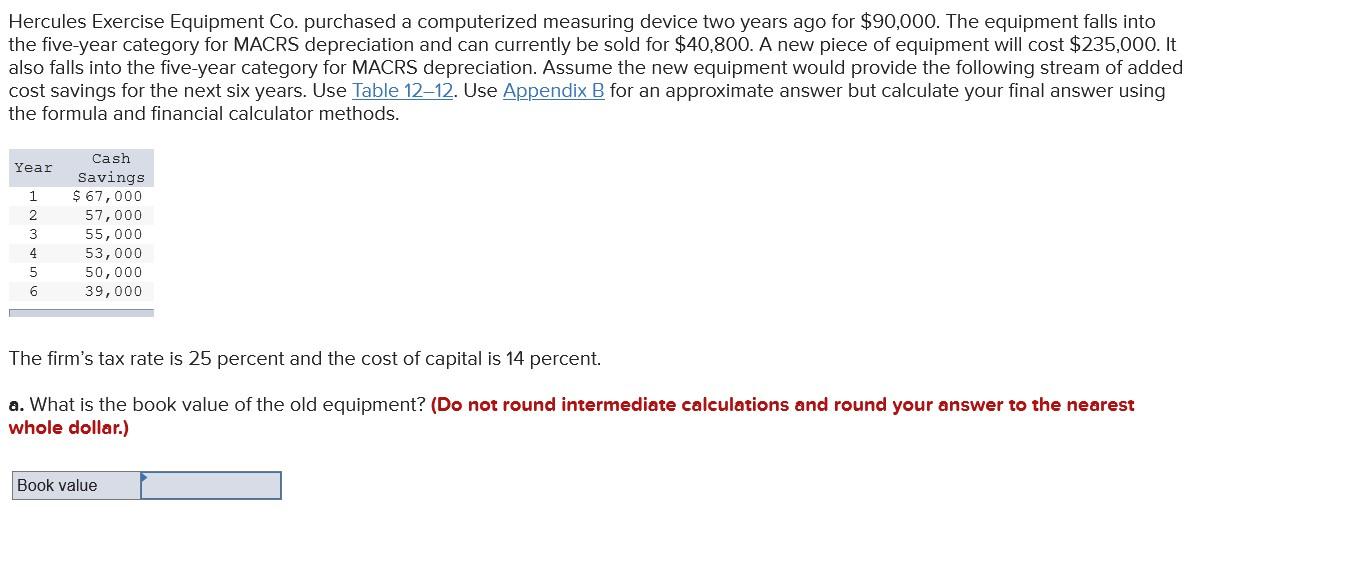
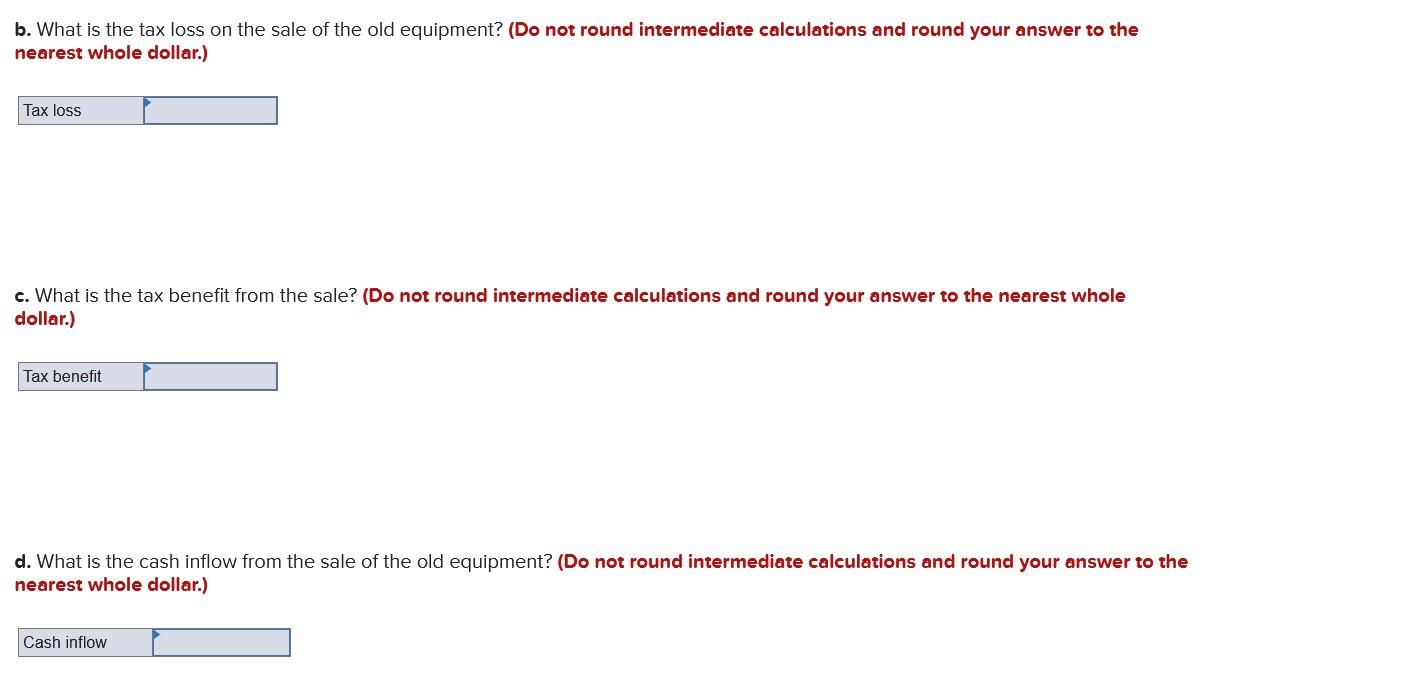
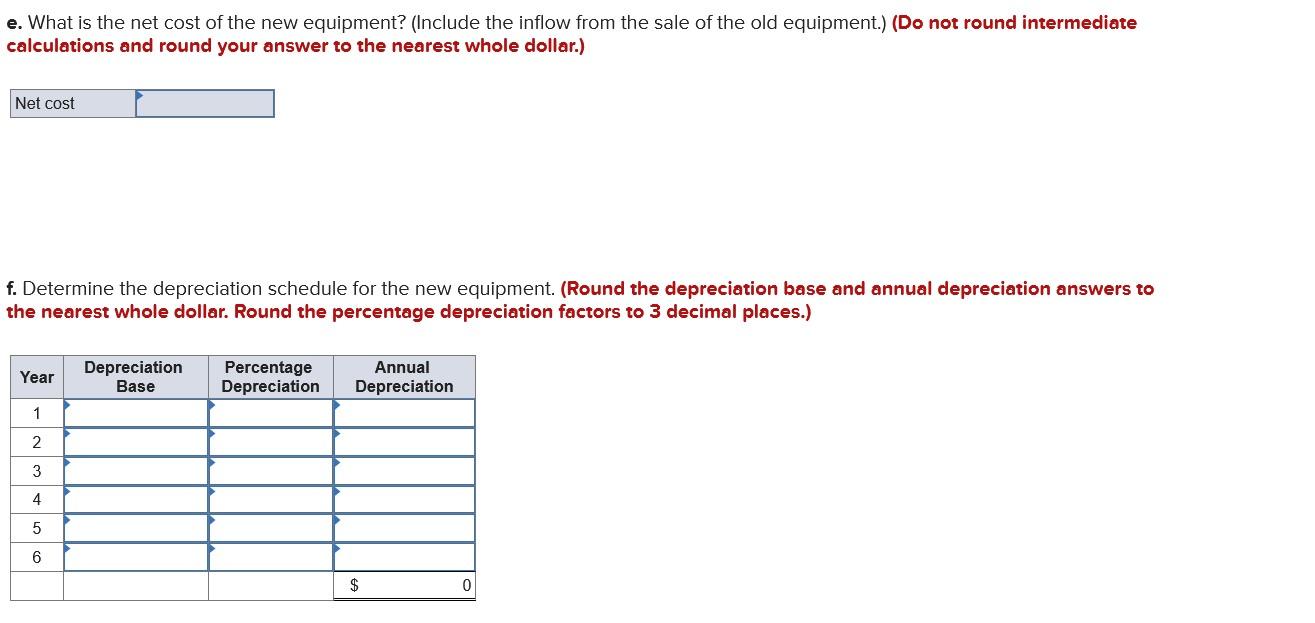
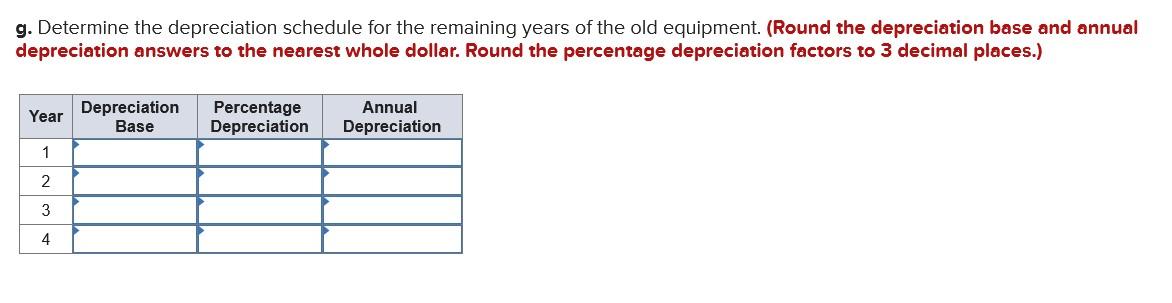
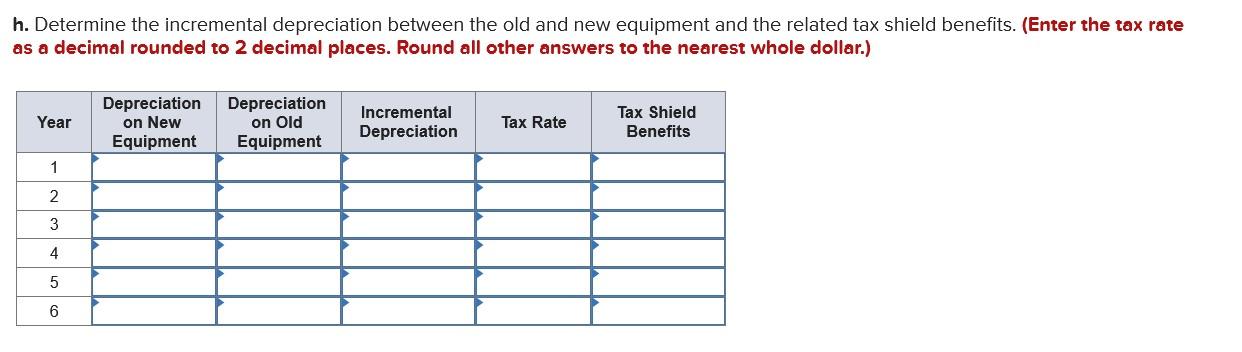
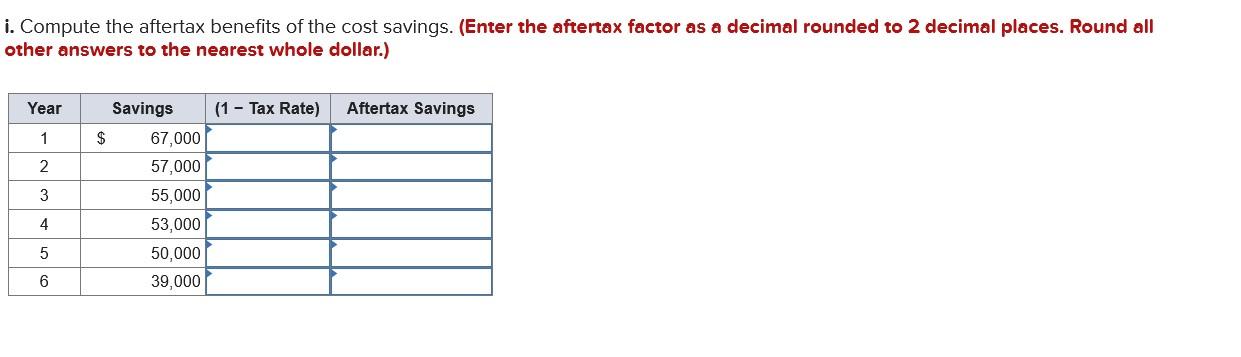
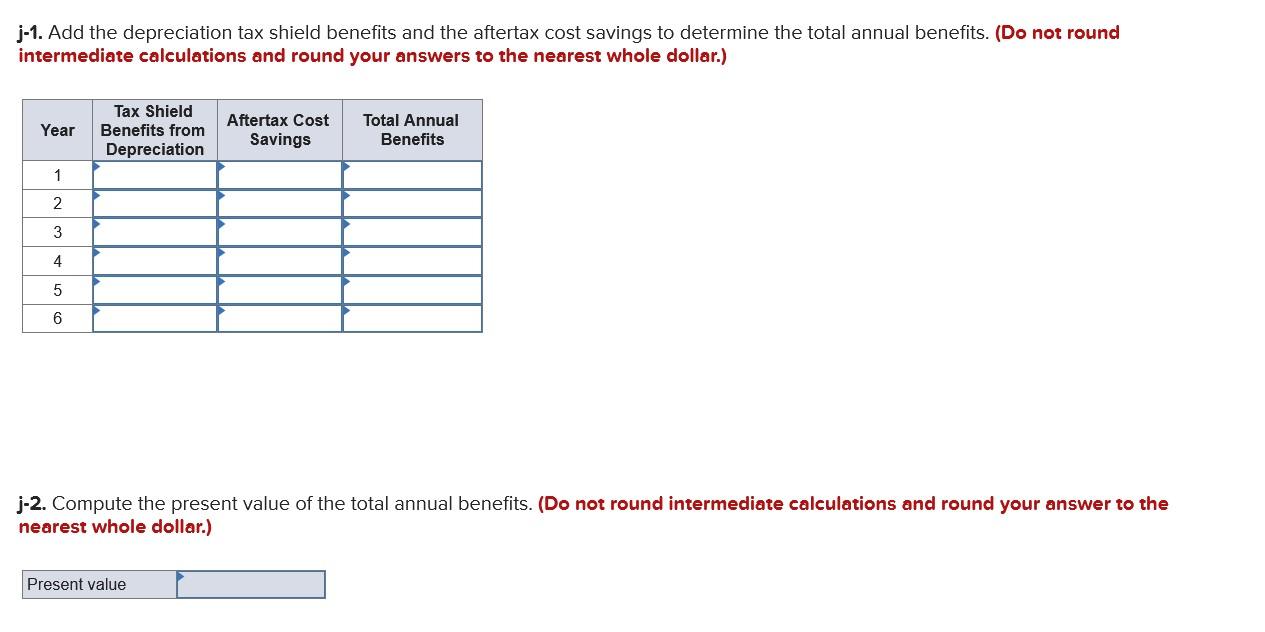
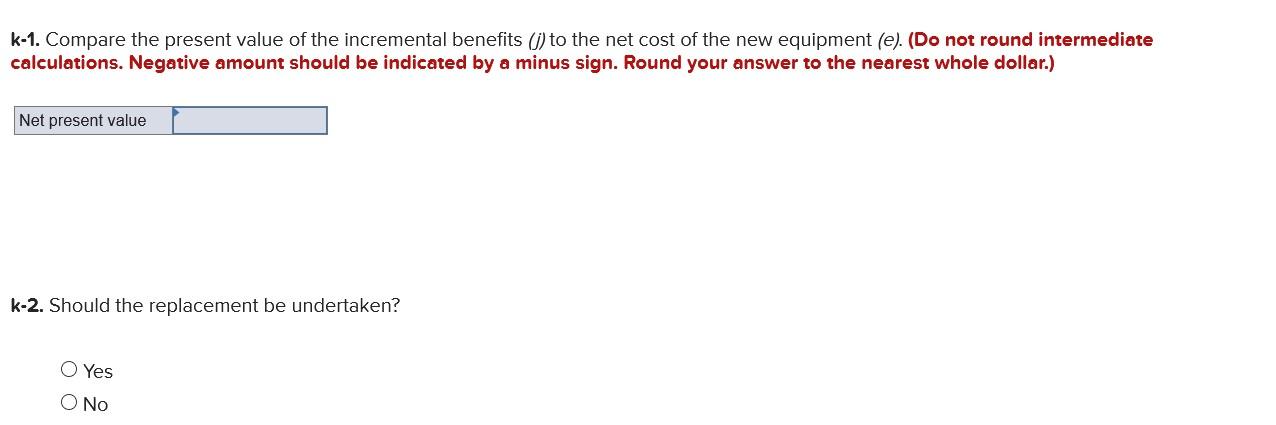
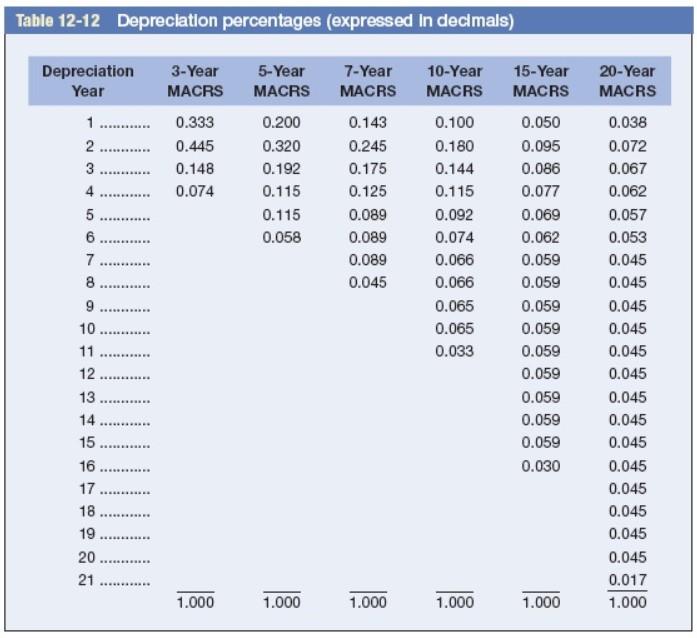
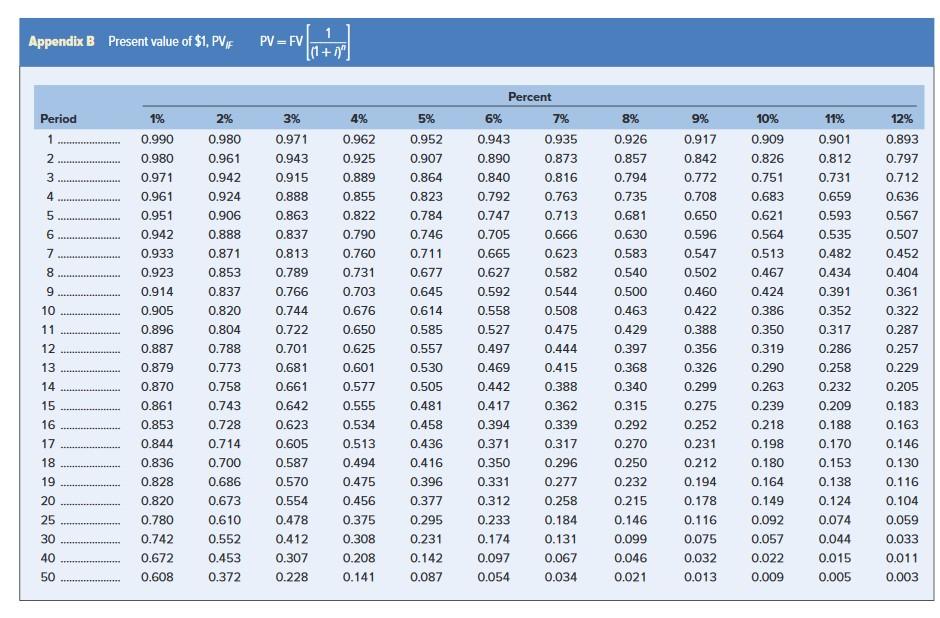
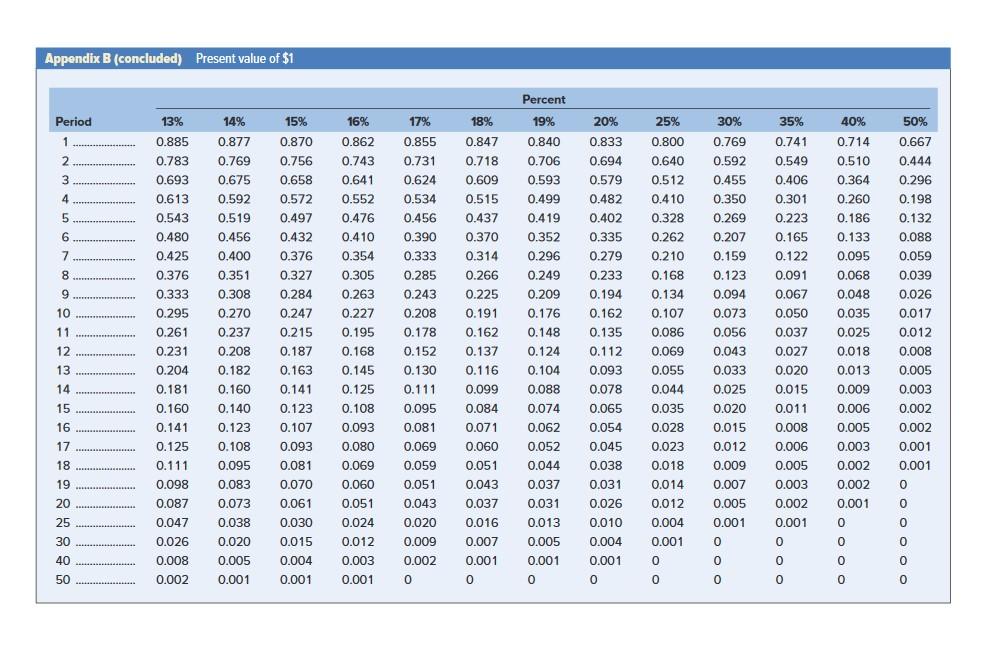
Hercules Exercise Equipment Co. purchased a computerized measuring device two years ago for $90,000. The equipment falls into the five-year category for MACRS depreciation and can currently be sold for $40,800. A new piece of equipment will cost $235,000. It also falls into the five-year category for MACRS depreciation. Assume the new equipment would provide the following stream of added cost savings for the next six years. Use Table 1212. Use Appendix B for an approximate answer but calculate your final answer using the formula and financial calculator methods. Year 1 2 3 4 5 6 Cash Savings $ 67,000 57,000 55,000 53,000 50,000 39,000 The firm's tax rate is 25 percent and the cost of capital is 14 percent. a. What is the book value of the old equipment? (Do not round intermediate calculations and round your answer to the nearest whole dollar.) Book value b. What is the tax loss on the sale of the old equipment? (Do not round intermediate calculations and round your answer to the nearest whole dollar.) Tax loss c. What is the tax benefit from the sale? (Do not round intermediate calculations and round your answer to the nearest whole dollar.) Tax benefit d. What is the cash inflow from the sale of the old equipment? (Do not round intermediate calculations and round your answer to the nearest whole dollar.) Cash inflow e. What is the net cost of the new equipment? (Include the inflow from the sale of the old equipment.) (Do not round intermediate calculations and round your answer to the nearest whole dollar.) Net cost f. Determine the depreciation schedule for the new equipment. (Round the depreciation base and annual depreciation answers to the nearest whole dollar. Round the percentage depreciation factors to 3 decimal places.) Year Depreciation Base Percentage Depreciation Annual Depreciation 1 2 3 4 5 6 $ 0 g. Determine the depreciation schedule for the remaining years of the old equipment. (Round the depreciation base and annual depreciation answers to the nearest whole dollar. Round the percentage depreciation factors to 3 decimal places.) Year Depreciation Base Percentage Depreciation Annual Depreciation 1 2 3 4 h. Determine the incremental depreciation between the old and new equipment and the related tax shield benefits. (Enter the tax rate as a decimal rounded to 2 decimal places. Round all other answers to the nearest whole dollar.) Year Depreciation on New Equipment Depreciation on Old Equipment Incremental Depreciation Tax Rate Tax Shield Benefits 1 2 3 4 5 6 i. Compute the aftertax benefits of the cost savings. (Enter the aftertax factor as a decimal rounded to 2 decimal places. Round all other answers to the nearest whole dollar.) Year (1 - Tax Rate) Aftertax Savings 1 $ 2 3 Savings 67,000 57,000 55,000 53,000 50,000 39,000 4 5 6 j-1. Add the depreciation tax shield benefits and the aftertax cost savings to determine the total annual benefits. (Do not round intermediate calculations and round your answers to the nearest whole dollar.) Year Tax Shield Benefits from Depreciation Aftertax Cost Savings Total Annual Benefits 1 2 3 4 5 6 j-2. Compute the present value of the total annual benefits. (Do not round intermediate calculations and round your answer to the nearest whole dollar.) Present value k-1. Compare the present value of the incremental benefits (1) to the net cost of the new equipment (e). (Do not round intermediate calculations. Negative amount should be indicated by a minus sign. Round your answer to the nearest whole dollar.) Net present value k-2. Should the replacement be undertaken? O Yes O No Table 12-12 Depreciation percentages (expressed In decimals) 5-Year MACRS 7-Year MACRS Depreciation Year 1. 2. 3 4 5 6 7 8 9 3-Year MACRS 0.333 0.445 0.148 0.074 0.200 0.320 0.192 0.115 0.115 0.058 - 0.143 0.245 0.175 0.125 0.089 0.089 0.089 0.045 10-Year MACRS 0.100 0.180 0.144 0.115 0.092 0.074 0.066 0.066 0.065 0.065 0.033 15-Year MACRS 0.050 0.095 0.086 0.077 0.069 0.062 0.059 0.059 0.059 0.059 0.059 0.059 0.059 0.059 0.059 0.030 10 ........... 20-Year MACRS 0.038 0.072 0.067 0.062 0.057 0.053 0.045 0.045 0.045 0.045 0.045 0.045 0.045 0.045 0.045 0.045 0.045 0.045 0.045 0.045 0.017 1.000 . 11 12 13 14 15 16 17 18 19 20... 21 . 1.000 1.000 1.000 1.000 1.000 Appendix B Present value of $1, PVF PV=FV 1 [(1+") Period 1% 3% 12% 1 NM 4 0.893 0.797 0.712 0.636 0.567 0.507 0.452 5 0.990 0.980 0.971 0.961 0.951 0.942 0.933 0.923 0.914 0.905 0.896 6 7 8 0.404 9 10 11 12 2% 0.980 0.961 0.942 0.924 0.906 0.888 0.871 0.853 0.837 0.820 0.804 0.788 0.773 0.758 0.743 0.728 0.714 0.700 0.686 0.673 0.610 0.552 0.453 0.372 0.887 0.971 0.943 0.915 0.888 0.863 0.837 0.813 0.789 0.766 0.744 0.722 0.701 0.681 0.661 0.642 0.623 0.605 0.587 0.570 0.554 0.478 0.412 0.307 0.228 4% 0.962 0.925 0.889 0.855 0.822 0.790 0.760 0.731 0.703 0.676 0.650 0.625 0.601 0.577 0.555 0.534 0.513 0.494 0.475 0.456 0.375 0.308 0.208 0.141 Percent 6% 7% 0.943 0.935 0.890 0.873 0.840 0.816 0.792 0.763 0.747 0.713 0.705 0.666 0.665 0.623 0.627 0.582 0.592 0.544 0.558 0.508 0.527 0.475 0.497 0.444 0.469 0.415 0.442 0.388 0.417 0.362 0.394 0.339 0.371 0.317 0.350 0.296 0.331 0.277 0.312 0.258 0.233 0.184 0.174 0.131 0.097 0.067 0.054 0.034 5% 0.952 0.907 0.864 0.823 0.784 0.746 0.711 0.677 0.645 0.614 0.585 0.557 0.530 0.505 0.481 0.458 0.436 0.416 0.396 0.377 0.295 0.231 0.142 0.087 8% 0.926 0.857 0.794 0.735 0.681 0.630 0.583 0.540 0.500 0.463 0.429 0.397 0.368 0.340 0.315 0.292 0.270 0.250 0.232 0.215 0.146 0.099 0.046 0.021 9% 0.917 0.842 0.772 0.708 0.650 0.596 0.547 0.502 0.460 0.422 0.388 0.356 0.326 0.299 0.275 0.252 0.231 0.212 0.194 0.178 0.116 0.075 0.032 0.013 10% 0.909 0.826 0.751 0.683 0.621 0.564 0.513 0.467 0.424 0.386 0.350 0.319 0.290 0.263 0.239 0.218 0.198 0.180 0.164 0.149 0.092 0.057 0.022 0.009 11% 0.901 0.812 0.731 0.659 0.593 0.535 0.482 0.434 0.391 0.352 0.317 0.286 0.258 0.232 0.209 0.188 0.170 0.153 0.138 0.124 0.074 0.044 0.015 0.005 13 14 15 16 0.361 0.322 0.287 0.257 0.229 0.205 0.183 0.163 0.146 0.130 0.116 0.104 0.059 0.033 0.011 0.003 17 0.879 0.870 0.861 0.853 0.844 0.836 0.828 0.820 0.780 0.742 0.672 0.608 18 19 20 25 30 40 50 Appendix B (concluded) Present value of $1 Period 25% 40% 1 2 3 4 5 6 7 8 13% 0.885 0.783 0.693 0.613 0.543 0.480 0.425 0.376 0.333 0.295 0.261 0.231 0.204 0.181 0.160 0.141 0.125 0.111 0.098 0.087 0.047 9 Percent 19% 0.840 0.706 0.593 0.499 0.419 0.352 0.296 0.249 0.209 0.176 0.148 0.124 0.104 0.088 17% 0.855 0.731 0.624 0.534 0.456 0.390 0.333 0.285 0.243 0.208 0.178 0.152 0.130 0.111 0.095 0.081 10 14% 0.877 0.769 0.675 0.592 0.519 0.456 0.400 0.351 0.308 0.270 0.237 0.208 0.182 0.160 0.140 0.123 0.108 0.095 0.083 0.073 0.038 0.020 0.005 0.001 15% 0.870 0.756 0.658 0.572 0.497 0.432 0.376 0.327 0.284 0.247 0.215 0.187 0.163 0.141 0.123 0.107 0.093 0.081 0.070 0.061 0.030 0.015 0.004 0.001 16% 0.862 0.743 0.641 0.552 0.476 0.410 0.354 0.305 0.263 0.227 0.195 0.168 0.145 0.125 0.108 0.093 0.080 0.069 0.060 0.051 0.024 0.012 0.003 0.001 11 18% 0.847 0.718 0.609 0.515 0.437 0.370 0.314 0.266 0.225 0.191 0.162 0.137 0.116 0.099 0.084 0.071 0.060 0.051 0.043 0.037 0.016 0.007 0.001 0 0 0.800 0.640 0.512 0.410 0.328 0.262 0.210 0.168 0.134 0.107 0.086 0.069 0.055 0.044 0.035 0.028 0.023 12 20% 0.833 0.694 0.579 0.482 0.402 0.335 0.279 0.233 0.194 0.162 0.135 0.112 0.093 0.078 0.065 0.054 0.045 0.038 0.031 0.026 0.010 0.004 0.001 0 30% 0.769 0.592 0.455 0.350 0.269 0.207 0.159 0.123 0.094 0.073 0.056 0.043 0.033 0.025 0.020 0.015 0.012 0.009 0.007 0.005 0.001 o 0 0.714 0.510 0.364 0.260 0.186 0.133 0.095 0.068 0.048 0.035 0.025 0.018 0.013 0.009 0.006 0.005 0.003 0.002 0.002 0.001 50% 0.667 0.444 0.296 0.198 0.132 0.088 0.059 0.039 0.026 0.017 0.012 0.008 0.005 0.003 0.002 0.002 0.001 0.001 0 0 35% 0.741 0.549 0.406 0.301 0.223 0.165 0.122 0.091 0.067 0.050 0.037 0.027 0.020 0.015 0.011 0.008 0.006 0.005 0.003 0.002 0.001 0 o 0 13 14 15 16 17 18 19 0.074 0.062 0.052 0.044 0.037 0.031 0.013 0.005 0.001 0 0.069 0.059 0.051 0.043 0.020 0.009 0.002 o 0.018 0.014 0.012 0.004 20 25 0 0 0 30 0.001 0 40 0.026 0.008 0.002 0 0 0 0 0 50 0 0
Step by Step Solution
There are 3 Steps involved in it

Get step-by-step solutions from verified subject matter experts