

Question: Here are comparative financial statement data for Carla Vista Company and Sandhill Company, two competitors. All data are as of December 31, 2022, and December
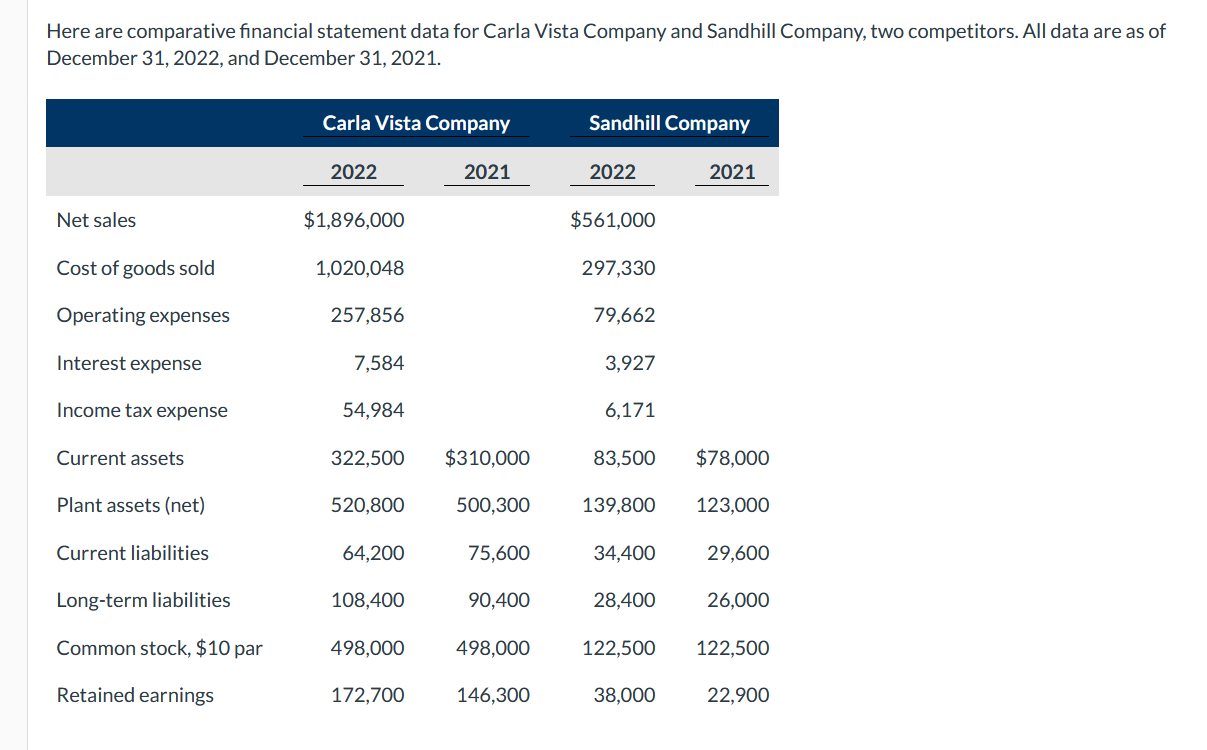
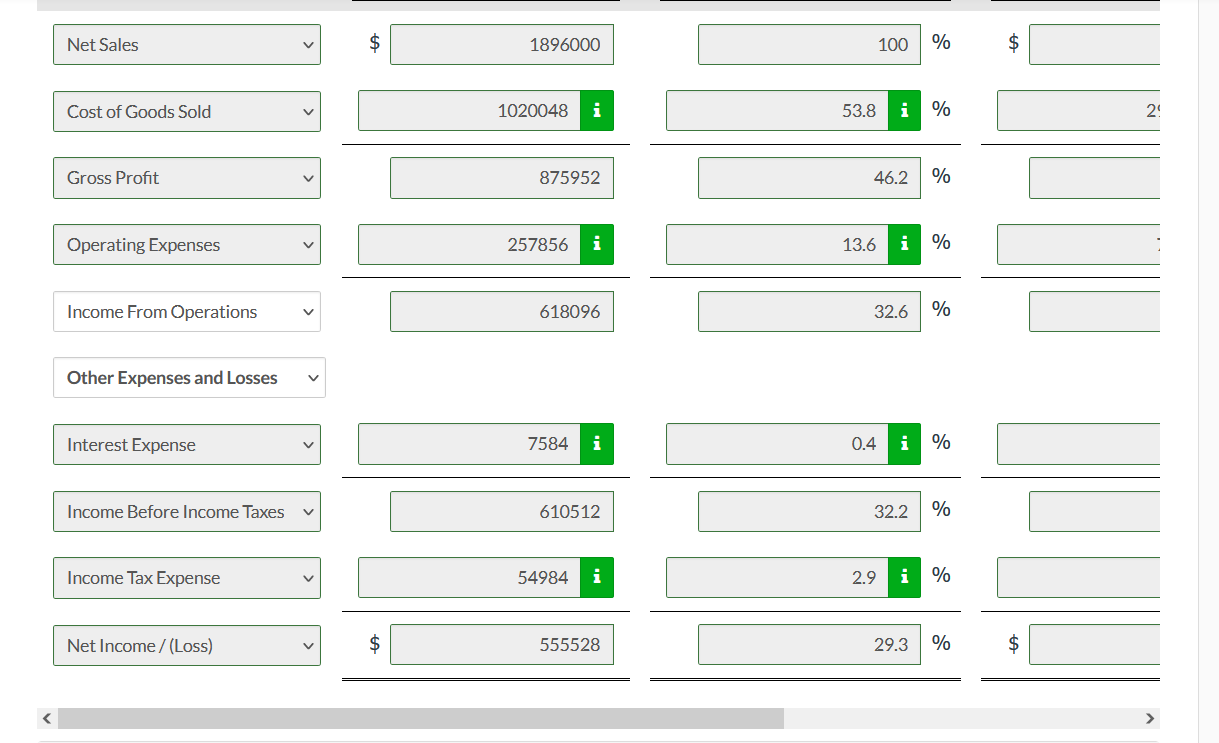
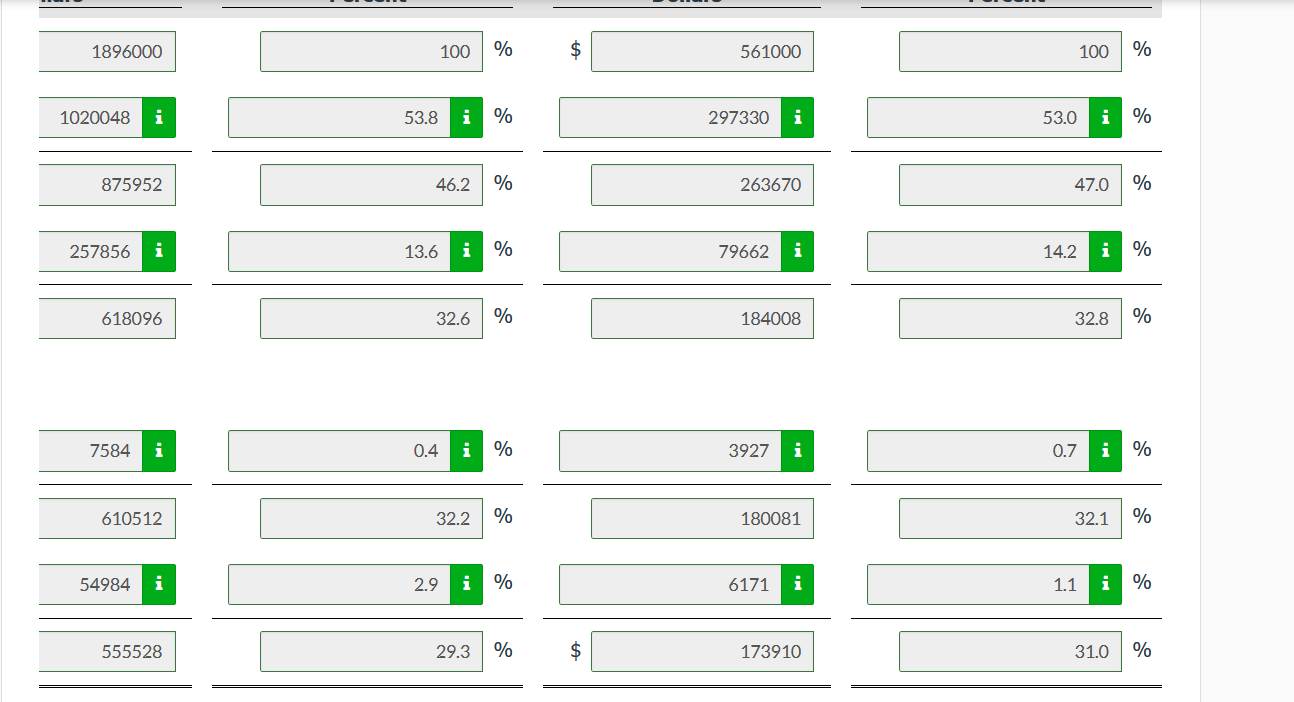
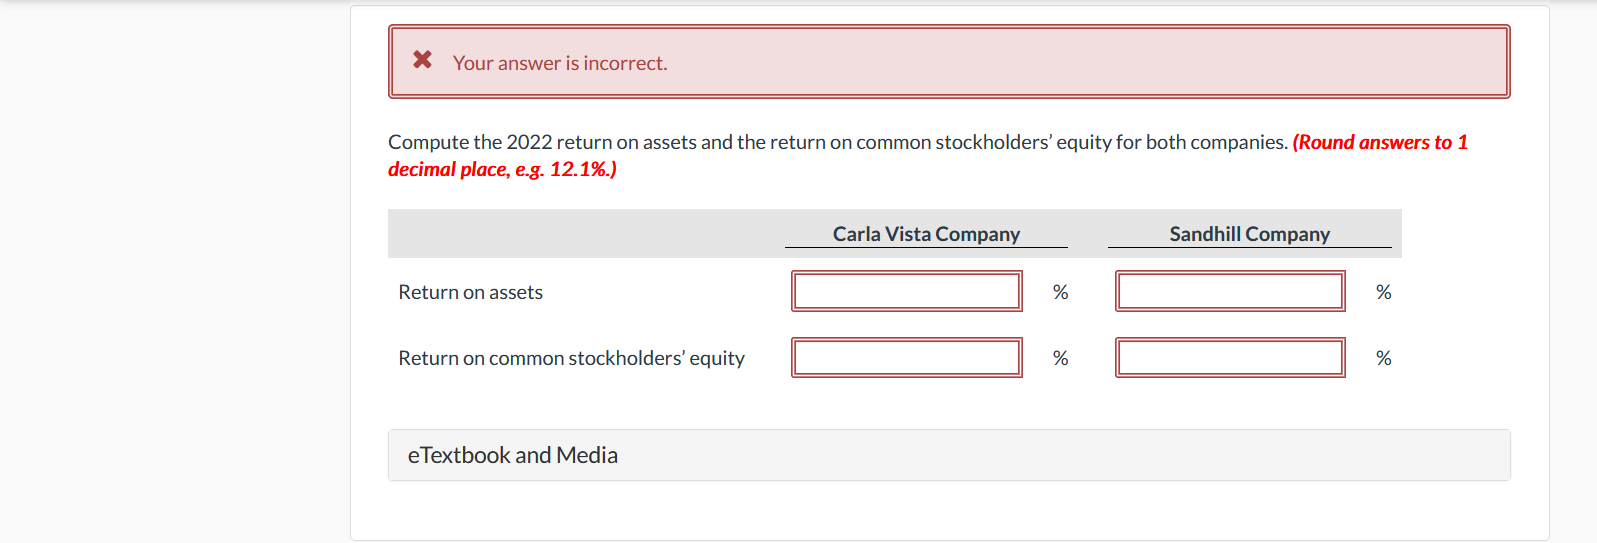
Here are comparative financial statement data for Carla Vista Company and Sandhill Company, two competitors. All data are as of December 31, 2022, and December 31, 2021. Net Sales $1896000 100% Other Expenses and Losses Interest Expense Income Tax Expense \begin{tabular}{|l|ll|} \hline 100 & % & $561000 \\ \hline \end{tabular} \begin{tabular}{|l|l} 1 & 100 \\ \hline \end{tabular} \begin{tabular}{rl|l|l|} \hline & 1.1 & i & % \\ \hline & & 31.0 & % \\ \hline \end{tabular} Compute the 2022 return on assets and the return on common stockholders' equity for both companies. (Round answers to 1 decimal place, e.g. 12.1\%.)
Step by Step Solution
There are 3 Steps involved in it
1 Expert Approved Answer
Step: 1 Unlock

Question Has Been Solved by an Expert!
Get step-by-step solutions from verified subject matter experts
Step: 2 Unlock
Step: 3 Unlock